Back to BioTapestry Home Page
Release Notes for Version 3.0.5
Version 3.0.5 was released on 11/11/08. Changes include:
- The Apple Mac 9/08 Java update issue was resolved
- The batch mode for generating images supports a new -compress option for CSV loads
- New Tools->Show count of network elements feature provides counts of genes, nodes, and links in a model
- There are now ten different evidence levels available for links (up from three)
- Significant improvements in memory footprint and execution speed for large CSV imports and network layout operations
- Several bug fixes, both for the Editor and the Viewer
Release Notes for Version 3.0
Version 3.0 was released on 09/30/08. It includes many significant new features:
-
Genes, nodes, and links can now be drawn at any level of the model hierarchy:
Previous versions of BioTapestry required the user to first create a top-level network, and
then select elements and propagate them into models lower down in the hierarchy. With Version 3.0,
users can simply draw new elements at any model layer. If a newly added element is not
present in the parent model(s), it is added automatically as needed. Note how in the following screenshot
the draw buttons in the right half of the toolbar are now active at levels below the top level. Also, there is a new
Add Region button on the toolbar, so that empty regions can be drawn and then
stocked with network elements:
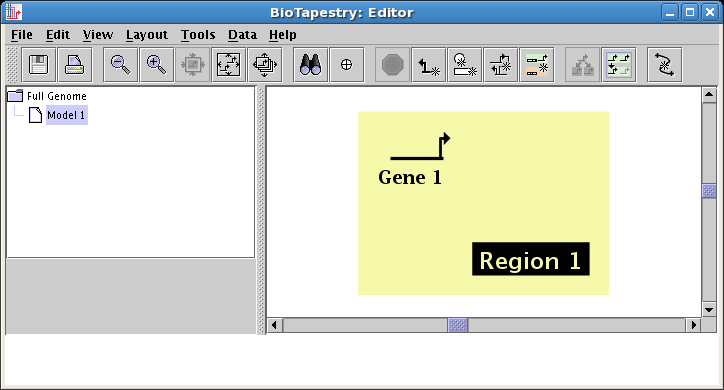
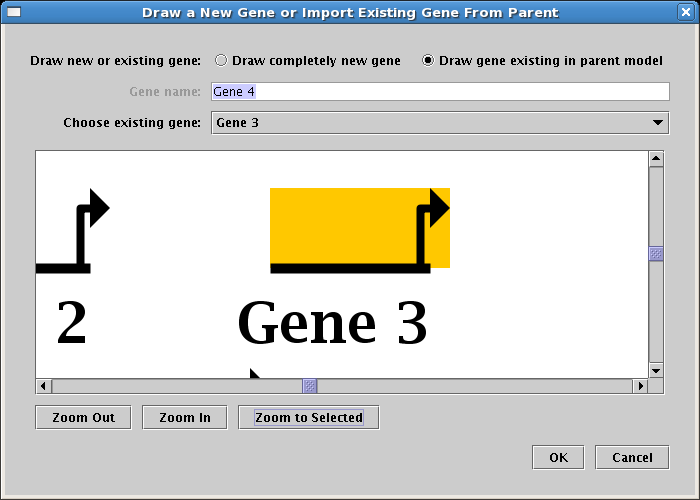
When drawing elements into lower-level models, the user is provided the option
to choose existing elements from parent models, or to create a completely new element:
-
Genes, nodes, and links can be "pulled down" from the top-level network: This is an additional
enhancement to make it easier to create and populate models at all levels of the hierarchy. In previous versions,
it was not possible to view the top-level root network and quickly click on all those elements you wanted to include in
your top-level instance model; that function was only available for building models at the bottom of the network
hierarchy. Otherwise, the Choose Subset of Parent button on the toolbar was disabled.
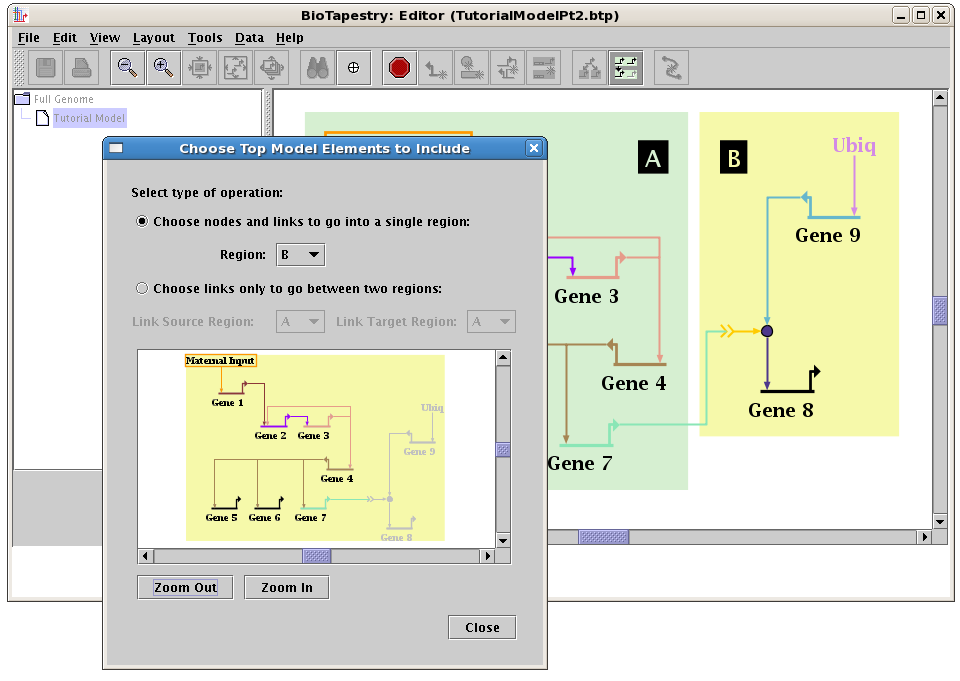
With Version 3.0, this feature is available at all levels. For building networks below
the top-level root model, clicking the Choose Subset of Parent button pops up a separate dialog
where you can quickly click on all the elements to pull down into the current model:
-
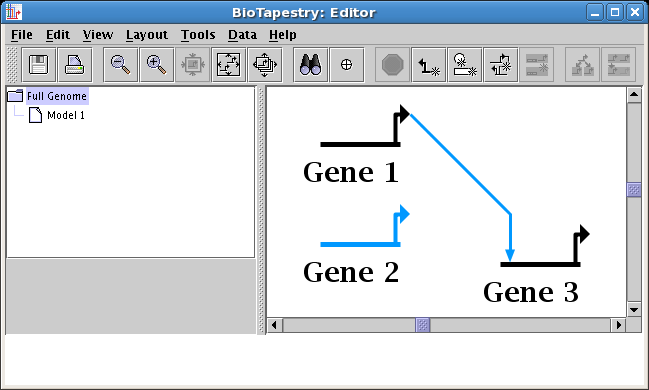
Change link source or target node: In the top-level model, the user can now choose to
move links from one node another, which can be a common procedure as the understanding of
a network changes over time, but can be challenging since these changes need to be applied to
all models in the hierarchy. The program takes care of changing all the submodels to
match the root-level change, and asks the user to clarify when there may be potential
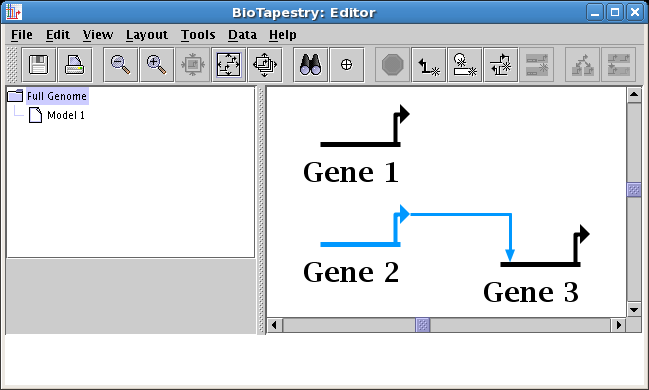
ambiguities that need resolution. To access this feature, right-click on a link and select either
Change Link Source Node or Change Link Target Node. For example, in the
following two screen shots, the user moves the source of the link going into Gene 3 from Gene 2 to Gene 1:
-
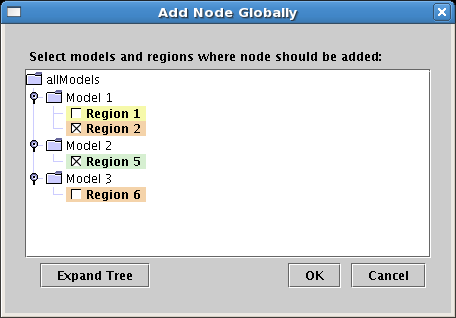
Global add of gene or node: Another feature that has been added to simplify the
editing and maintenance of large models over the long term is the ability to select
a gene or node and then choose the models and regions where it should be added
through a single global listing of the candidates. To access this feature, right-click
on the gene or node and select Add Node Globally.... In the dialog that appears,
you can check the boxes next to all the regions where you want to add the element:
-
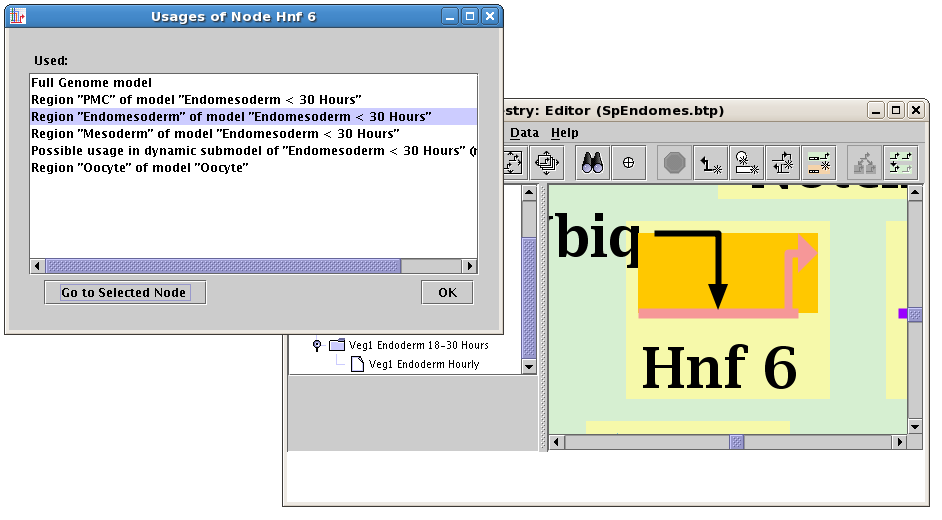
Global gene/node/linkage search and navigation: With large models, it is essential
to be able to find every usage of a particular network element across all models and regions,
then go and see that usage in context. Starting in version 3.0, the user can right-click on
these features, select Find All Usages... or Find All Usages of Links Through This Segment...,
and get a window listing all the places the feature is used (in static models). Selecting a usage and
clicking on the Go to Selected button will navigate to the feature:
-
Explicit region ordering: Regions can now be explictly assigned a drawing order,
so that the user can ensure that one region color block is drawn in front of another.
To change the region drawing order, right-click in an unoccupied section of a region and
select either Raise Region or Lower Region:
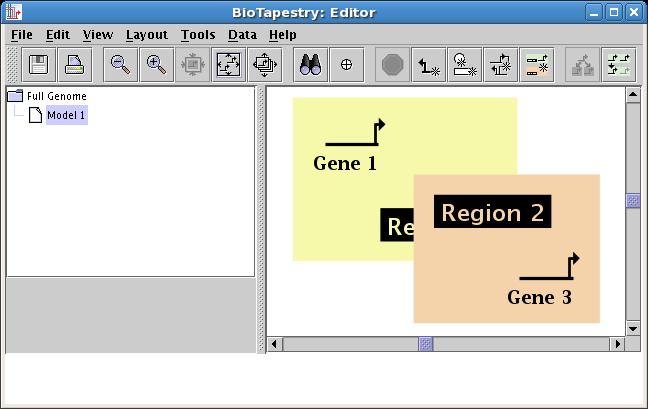
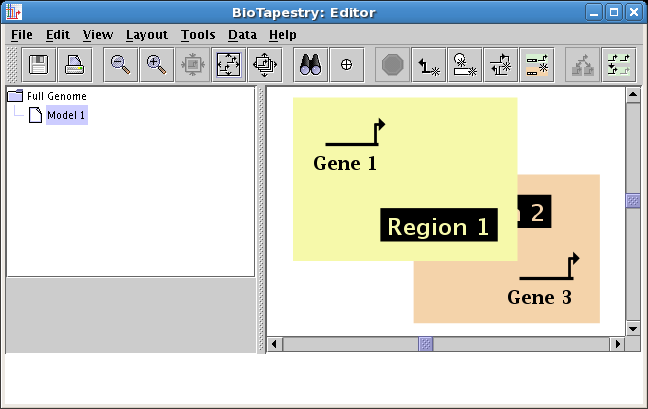
(One caveat is that this only affects the ordering of the region color rectangles; as always, all network elements are drawn after
these rectangles, so that no genes or links can be hidden behind an obscuring region block.)
-
Rapid stocking of a region: A region can be fully populated with the all the
network elements present in the parent model using a single operation, allowing the
user to build submodels much faster. To use this feature, right-click in an unoccupied
section of a region and select Import Entire Network into Region:
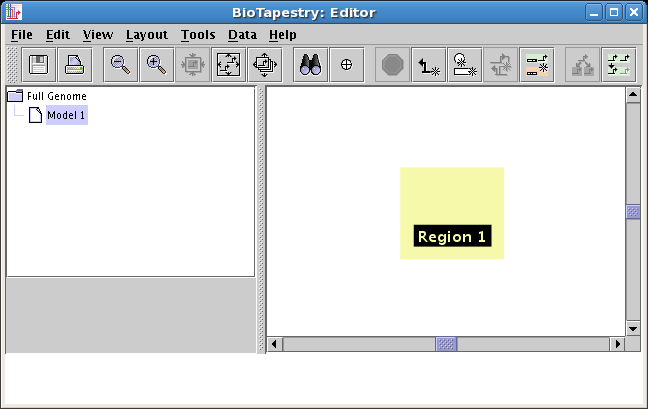
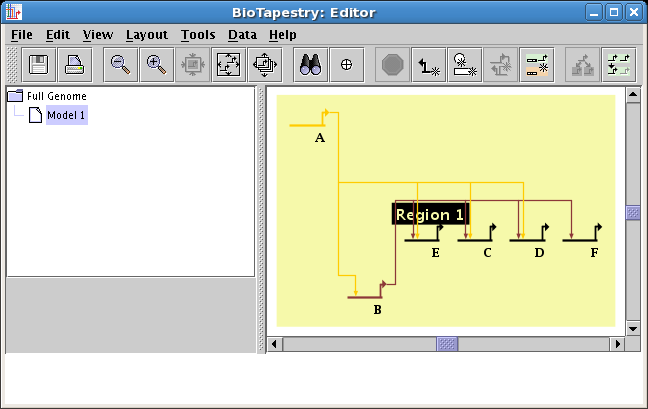
-
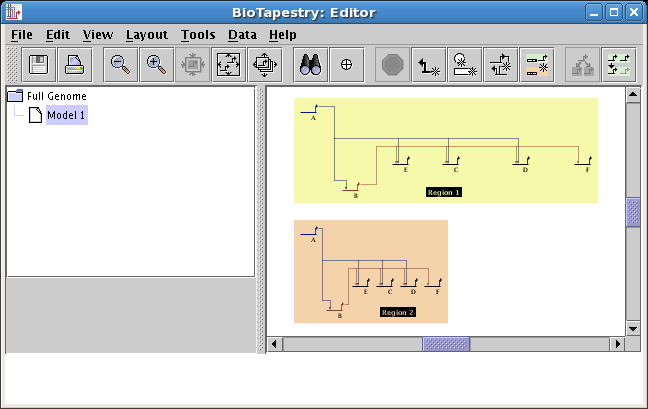
Networks can be expanded or compressed on a per-region basis: Previously,
network geometry could only be expanded or compressed for an entire model. These
operations can now be done on the granularity of regions. To expand or compress a region,
right-click in an unoccupied section of the region and select either Compress Region... or Expand Region...:
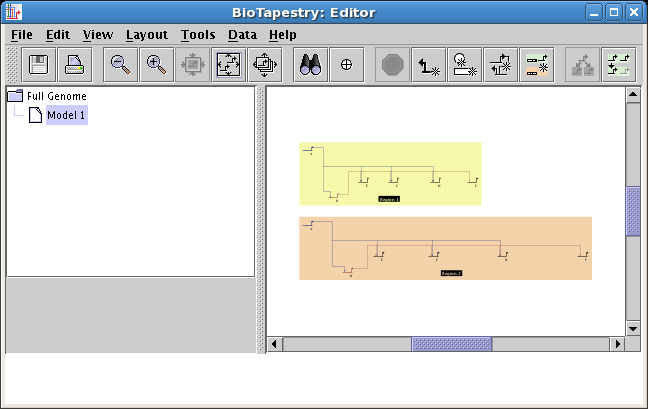
-
Other new region functions: Regions can now be moved as a unit; right-click in an unoccupied
section of a region and select Move Region. Also, region names can now be hidden. Select
Properties... from the right-click menu and choose the desired setting for Hide region label.
-
The Experimental Data display can be driven using web pages: The Experimental Data display (which is
accessed by right-clicking on a gene or node and selecting Experimental Data) has been customizable
in previous versions using small code plugins. To make this customization easier, the user can now stock the page by
simply specifying a list of URLs for (simplified) web pages. From the right-click menu for a gene or node,
select Properties... and choose the data URLs tab:
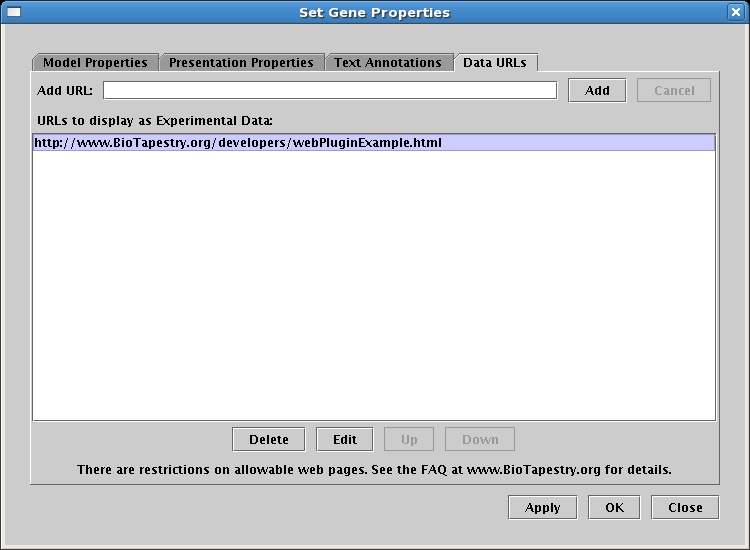
The web page restrictions alluded to in the dialog are as follows: These web pages should just use basic HTML,
and the web page creator should keep in mind that the bodies of each separate web page in the list will be
excised and inserted in the given order into the single web page used by the Experimental Data window.
Embedded images should be specified using absolute URLs. There should not be any embedded links, as they
will not be clickable, since the Experimental Data display is not currently interactive.
Also, if you are creating a set of pages to
be used by the BioTapestry Viewer (as opposed to the Editor), they should be located on
the same web server hosting the Viewer. There are security restrictions imposed by Java that prevents
an unsigned program (such as the Viewer) from accessing any web server except the one it originated on.
The BioTapestry Editor is signed and is not restricted in this fashion.
-
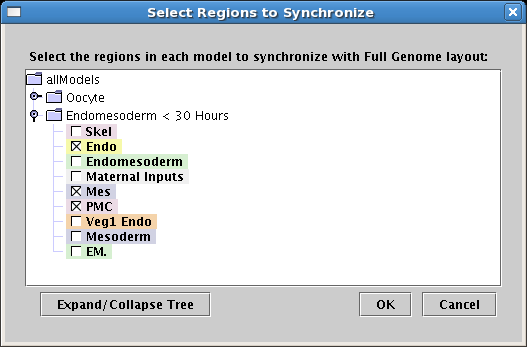
Improved layout synchronization: The ability to flexibly synchronize network layouts between models
is crucial. Starting in Version 3.0, the root layout can be propagated to only a subset of regions and
models in the hierarchy; previous versions synchronized everything. To access this feature, select the
top-level model, select Layout->Synchronize All Layouts... from the root menu, and select the
targets from the displayed tree:
In addition, the layout synchronization algorithm has been improved to do a better job
of retaining the existing region positions and cross-region link layouts.
-
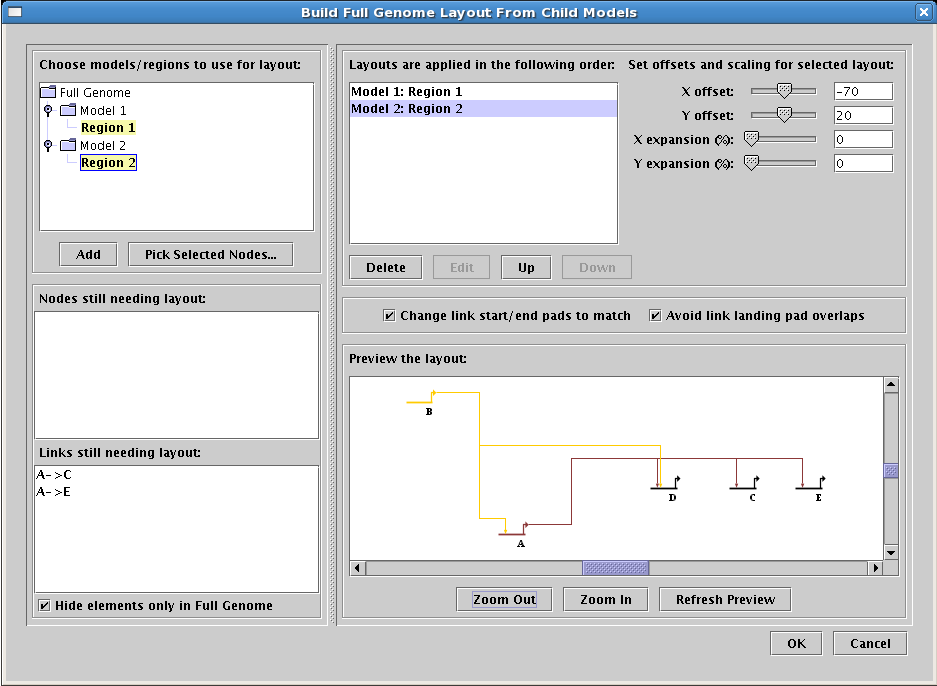
Modify root layout to match child model layouts. In those cases where the user changes the layout of the
networks below the top-level root model, it is very useful to be able to modify the root model layout to
match those changes. This feature has been added in Version 3.0. In all but the simplest cases, this requires
the user to specify which child layout of many should be used to layout each element in the root model.
This process is guided by a worksheet that allows the user to choose among child layouts, with running tallys
of the elements that still require user attention and feedback on the result (see below). Once a merging strategy is
devised, it is stored and can be reused repeatedly. To access this feature, select
Layout->Propagate Layout to Full Genome Model...:
-
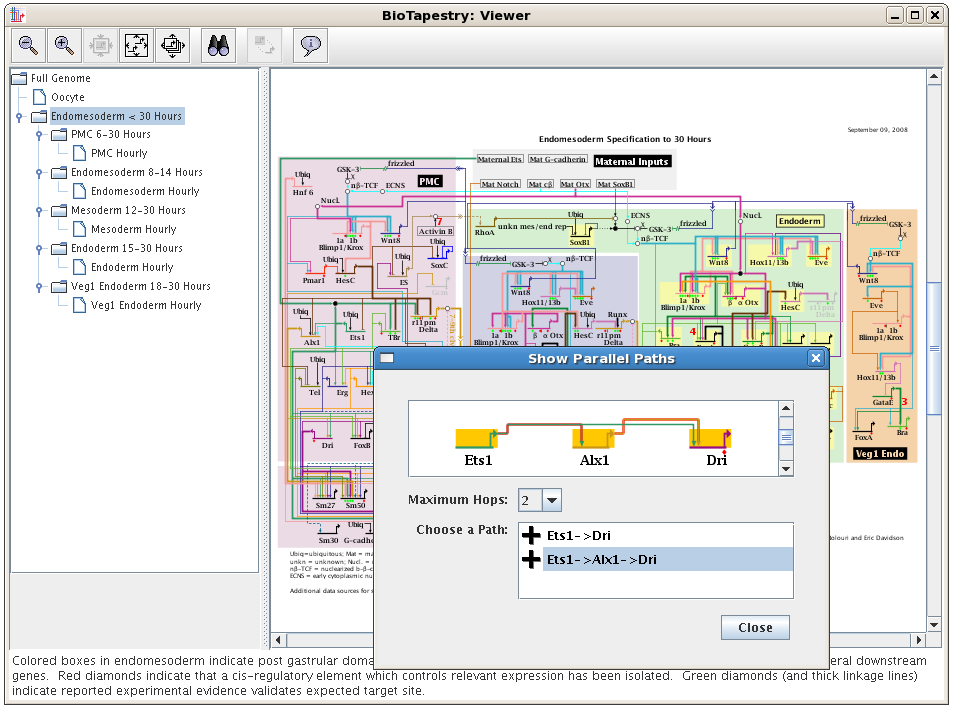
Enhanced BioTapestry Viewer: The BioTapestry Viewer has been enhanced with many features that
were previously only available in the Editor, such as search, finding sources and targets of nodes,
exploring alternate network paths, and zooming to selected elements:
-
New headless batch mode When using BioTapestry at the end of a computational pipeline for generating
images of networks, it is very useful to be able to run it in batch mode. Version 3.0 adds this new mode.
For input, the program accepts either a regular .btp file or a comma-separated value (CSV) file (using -csvImport) as described in
the CSV Tutorial. For output, you
can specify (using -webExport) a directory to get a full set of html pages with images, a single image file
(using -imageExport), or a .btp file (using -saveFile). Some examples:
Use inputFile.btp to generate a full set of images and pages to webDirectory (the access point is webDirectory/BTLauncher.html)
and a single image of the default network (i.e. the one shown when the program starts up) to outputImage.png:
$JAVAHOME/bin/java -Xmx512m org.systemsbiology.biotapestry.app.ImageGeneratorApplication -webExport webDirectory -imageExport outputImage.png inputFile.btp
Take the CSV input file input.csv and run the CSV import procedure to create and save the file outputFile.btp:
$JAVAHOME/bin/java -Xmx512m org.systemsbiology.biotapestry.app.ImageGeneratorApplication -csvImport input.csv -saveFile outputFile.btp
Take the CSV input file input.csv and run the CSV import procedure to generate a single image of the default network (i.e. the one shown when the
program starts up) to outputImage.png:
$JAVAHOME/bin/java -Xmx512m org.systemsbiology.biotapestry.app.ImageGeneratorApplication -csvImport input.csv -imageExport outputImage.png
-
Improved automatic link layout algorithms: There have been improvements to the automatic link layout algorithm to
reduce link layout failures, provide better layout paths, and handle multiple link inputs into a single target pad. Also, the
link layout algorithm used in child models to handle cross-region link layout tries to do a better job of retaining the
existing link arrangement while doing incremental layout, layout synchronization, and network expansion or compression.
-
Per-embryo RNA counts can be imported and displayed: At this time, this data can be imported from an XML file
and displayed in the Experimental Data window. There is no user interface for editing these data. To access this feature,
select File->Import->Import Counts Per Embryo XML Data... from the the main menu. The file format used is, for example:
<CopiesPerEmbryoData>
  <copiesPerEmbryo gene="Gene 1">
    <copiesAtTime time="0" count="42" />
    <copiesAtTime time="6" count="122" />
    <copiesAtTime time="12" count="180" />
  </copiesPerEmbryo>
<CopiesPerEmbryoData>
-
Support for Gaggle version 2007-04 has been added: See the Gaggle website.
-
Semantic changes to the Davidson Lab QPCR data CSV import format: Contact us for details.
-
Efficiency improvements and bug fixes
Back to BioTapestry Home Page
Last updated: September 5, 2023
biotapestry at systemsbiology dot org


