|
|
|
|
|
|
|
|
Version 4.1.0 was released on 12/03/09. Changes include:
Version 4.0.1 was released on 11/04/09. Changes include:
Networks can now be annotated in a variety of ways using Network Overlays:
Since a single network can be described in terms of many different types of high-level abstractions, a given network model can have multiple network overlays defined for it. Furthermore, since network overlays are not constrained by the model hierarchy, submodels can each have network overlays that are different from their parent models.
For each overlay, you define a set of Network Modules, each of which contains genes and other nodes. You can also create links between the modules to show high-level interactions between the modules.
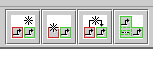
The network overlay features can be accessed either via the main menu by choosing Edit->Manage Network Overlays and Modules, or by using the buttons provided on the toolbar, shown below. The leftmost button (Add Network Overlay...) is always visible, while the other three buttons (Draw a New Network Module..., Draw a New Network Module Link..., and Toggle Network Module Component Display) will appear if a network overlay has been created:
Additional per-module features are accessed by right-clicking on a module's name or boundary.
Network overlays can have one of three presentation types: transparent, underlay, and opaque. You select the Presentation style when creating the overlay:
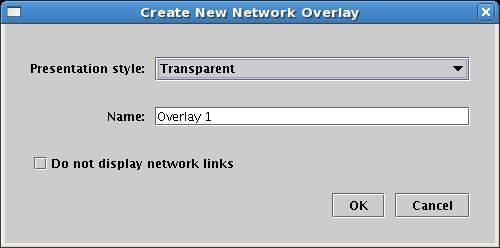
Transparent overlays appear as a set of colored outlines overlaid over the network features:
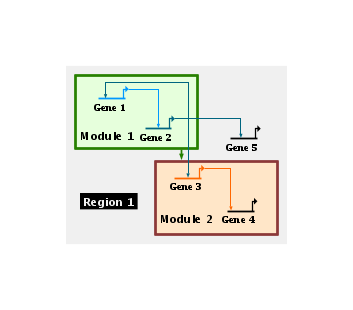
The underlay style draws the modules beneath the network elements as filled color boxes:
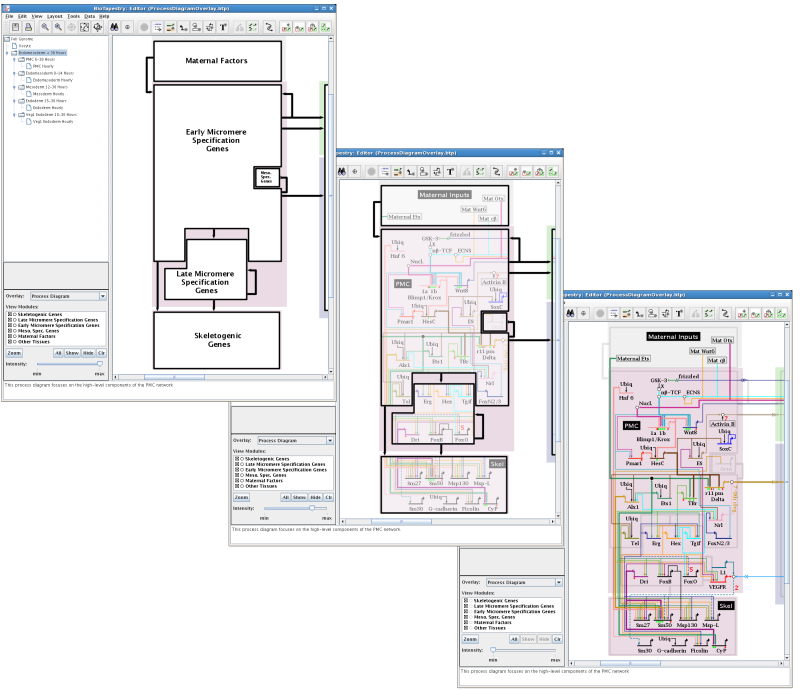
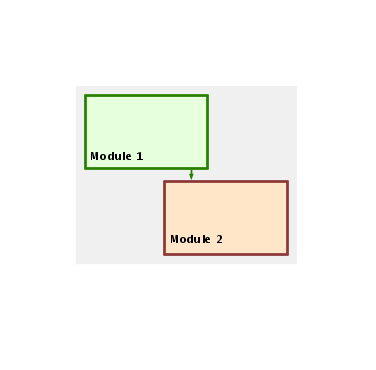
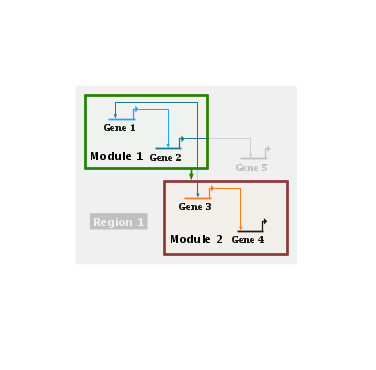
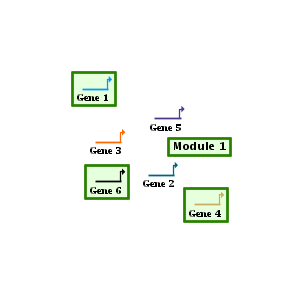
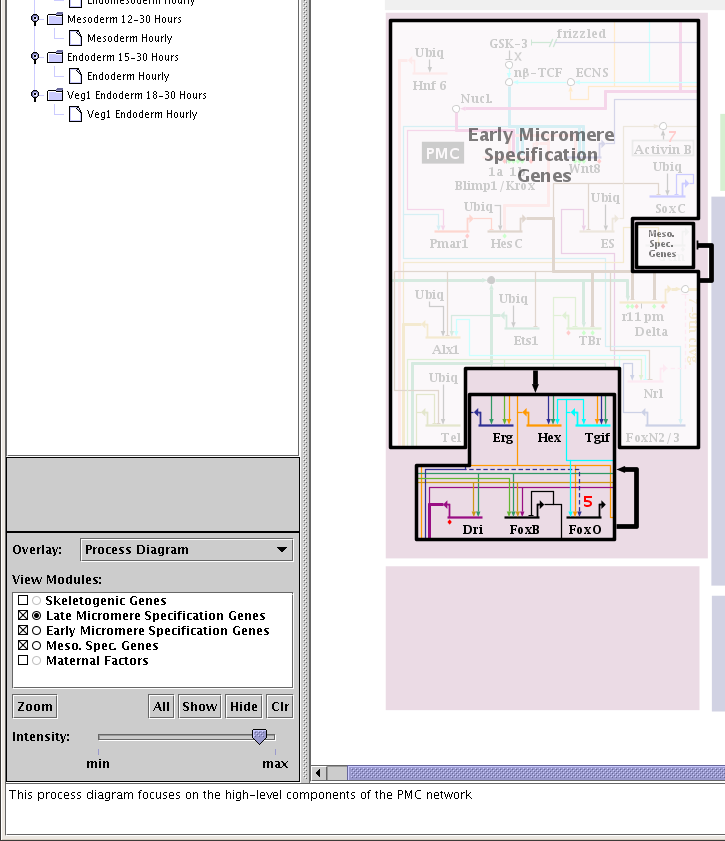
The opaque style creates an opaque layer over the network, and allows you to create high-level block diagrams that hide the details of the network:
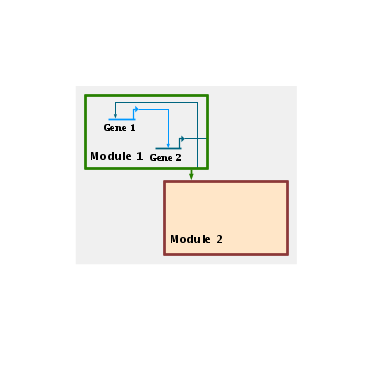
With an opaque overlay, you can reveal the details of different modules while still keeping most of the view as the high-level block diagram. One way to do this is to right-click on the module or module name and select Show/Hide Module Contents from the menu:
You can also reduce the opacity of the overlay, using the Intensity slider in the lower left corner of the BioTapestry window, to be able to see the whole network while still keeping the overlay visible enough to provide guidance:
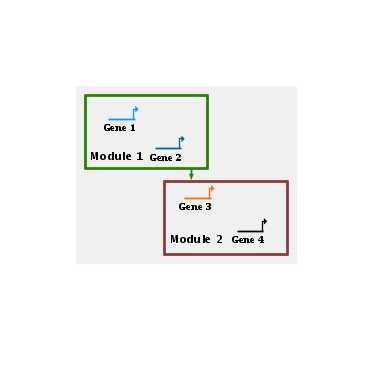
Another option is to set an overlay to only show genes and nodes, which allows you to focus on module memberships without the additional complexity of links:
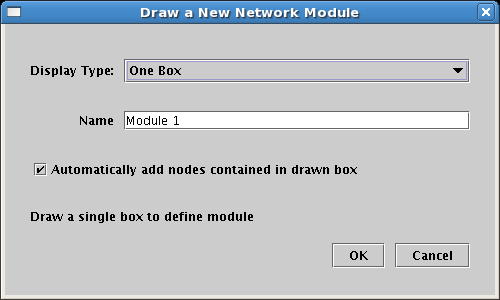
A network overlay contains a set of network modules, which are sets of network genes and nodes. Network modules are drawn in a way that makes sure that all included nodes appear within the module, while insuring that non-members are excluded from the module. Some network modules contains nodes that are arranged in a compact, contiguous region, while other modules may consist of widely scattered, isolated nodes. To handle these different situations, network modules themselves have three different ways they can be depicted; you choose the Display Type when creating the module:
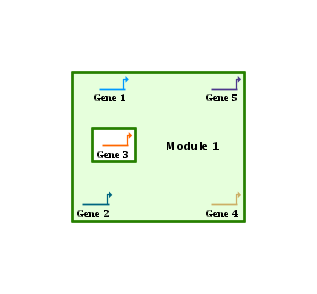
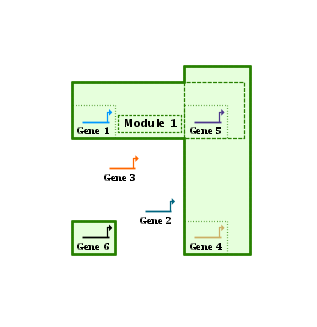
This first example below shows a One Box module, where all the nodes contained in the module are contained in a single box. In this example, Gene 1, Gene 2, Gene 4, and Gene 5 are in the module, but Gene 3 is not. So the system draws a single box around the four members, while automatically excluding the non-member:
You define a one box module by drawing a single box, which can be any size you want. But if you drag a module member outside of that box the system automatically tracks the move and makes the box as large as needed to bound all the members. So this one-box style starts to become unsatisfactory when there are many non-members inside the region bounding the members, and the region begins to look like swiss cheese. In this case, the better approach is to use a Multi-Box module, as shown below (Gene 2 and Gene 3 are not in the module in this example; the other genes are). With this style, you can draw as many boxes as you want, either intersecting or independent. The example below consists of two drawn boxes that intersect in the vicinity of Gene 5, which is automatically rendered as a single non-rectangular union of the two basic shapes. The box around Gene 6 below is automatically generated, since if you drag a member node outside of the defined set of boxes, it will automatically get enclosed in its own box that floats along with it:
Finally, when a module becomes fragmented and consists of widely scattered nodes, the Auto node boxing mode is the best. Each separate node in the module is drawn with an automatically generated enclosing box that floats along with it:
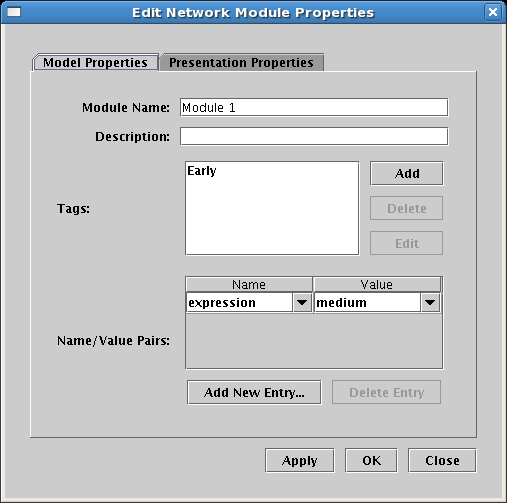
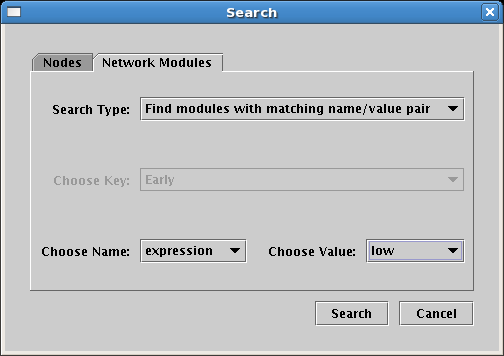
Modules can be assigned tags and name/value pairs:
Which can then be searched with a new tab on the search dialog:
Overlay and module selections are made using the control panel in the lower left of the application (see below). When you make a selection from the Overlay list, you are given the list of modules in the overlay to choose from. You can choose to only view some of the modules (by checking or unchecking the square box to the left of the module name), and (if the overlay is the opaque style) you can choose to reveal or hide the contents of modules by clicking on the round button on the left of the module name. Buttons below the module list let you quickly fill out or clear the list, and allow you to zoom to the currently viewed modules. You can also control the visibility of the overlay display with the Intensity slider at the bottom. In the example below, three of the five modules are visible, one module is completely revealed, and the other two are slightly visible because the Intensity slider has been backed off just a touch from the max setting:
If you want a particular overlay state to be the first view a user sees when they start to navigate through a model hierarchy, you just set the desired overlay state in the overlay control panel, right-click on the current model name in the left-hand model navigation panel, and select Make Current Overlay Selections the First View from the drop-down menu.
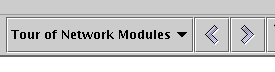
Finally, BioTapestry allows you to define named paths through the model hierarchy, so you can connect together models in different parts of the hierarchy in a simple linear progression. This feature is described in an online tutorial here. Network modules are completely integrated into this framework, so you can specify "stops" on a path that display certain modules in a given overlay:
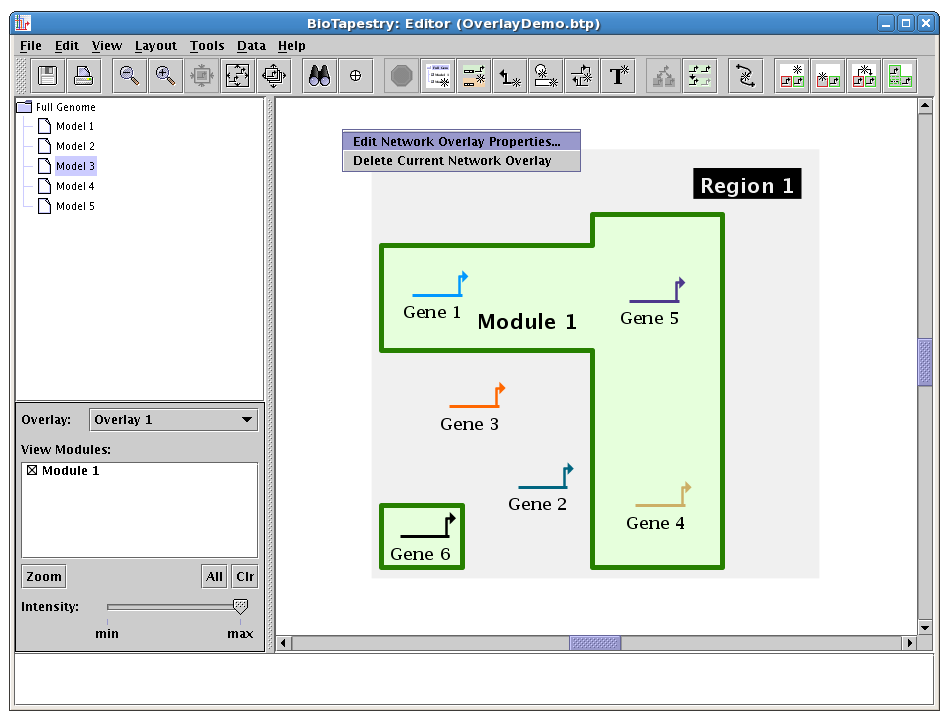
Once you have added an overlay, (and it is currently being displayed) you can modify its properties or delete it by right-clicking on a completely blank (including no region!) area of the network model and selecting the desired option:
Similarly, once a module has been drawn, it is easy to edit it. For example, to access the Edit Network Module Properties dialog, you just need to right-click on the module name or the module boundary to get the popup menu for the module, and you can select Properties... from that menu:
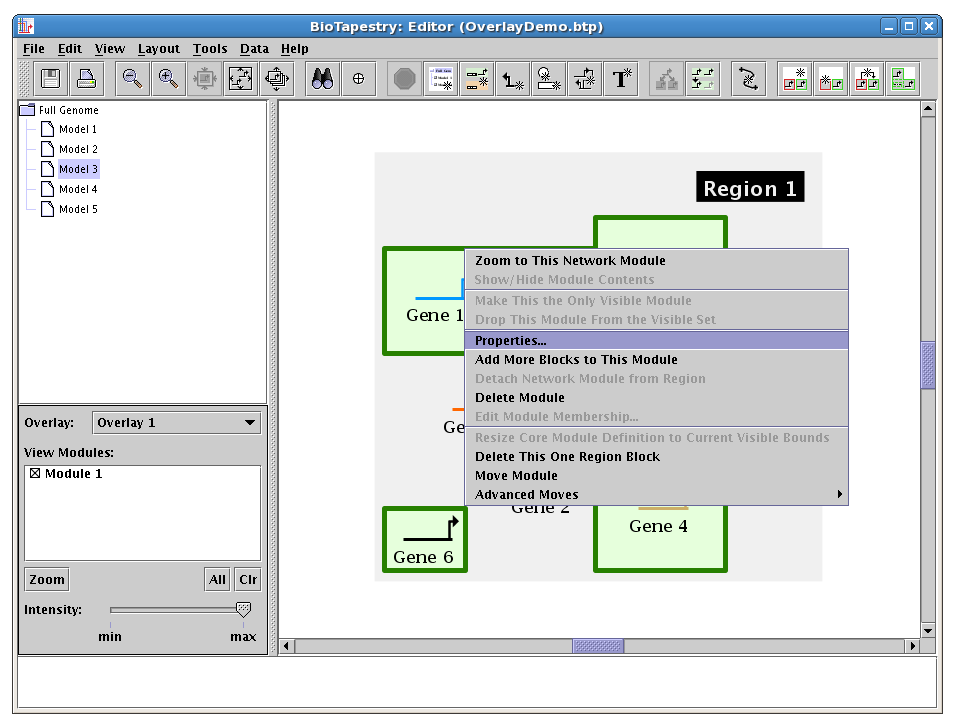
Note the popup menu also includes options like zooming, hiding/showing (active if the overlay is opaque), adding and deleting blocks, and moving the module around as a unit.
You can also drag module edges and corners around to change the geometry. One feature that makes dragging operations more intuitive is the ability to view the underlying module components. There is a toolbar button:
to toggle this view, and the view also pops on automatically during module drags and moves to give you a better feel for what is going on. Since the final module outline is driven by several factors (node member outlines, the module name, the separate overlapping modules areas) this component view showing all the pieces can clarify things:
BioTapestry network layout algorithms (e.g. auto layout, synchronization, propagation, compress/expand) have been enhanced to try to retain module geometry as best as possible across the various layout operations. The user is provided with a set of options (e.g. Shift and Resize Modules as Needed, or Convert all Network Modules to Auto Node Boxing) for modifying the module geometry during network layout operations.
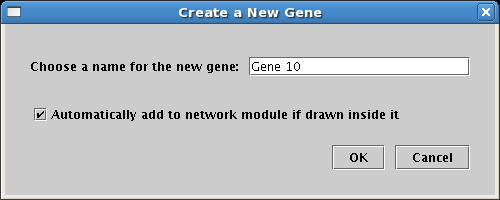
The creation of network modules is fully integrated with the drawing of nodes and genes. For example, you can start building a network model by first outlining high-level network architecture using network modules. Then as you draw in network elements, unless you override the default behavior, they will be automatically added to the modules they are drawn in:
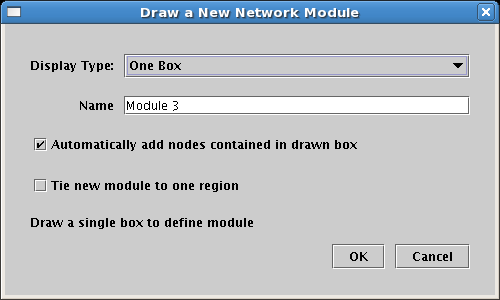
If you go the other direction and add modules to an existing network, the default behavior is to add all the nodes contained within the new module boundary into the module:
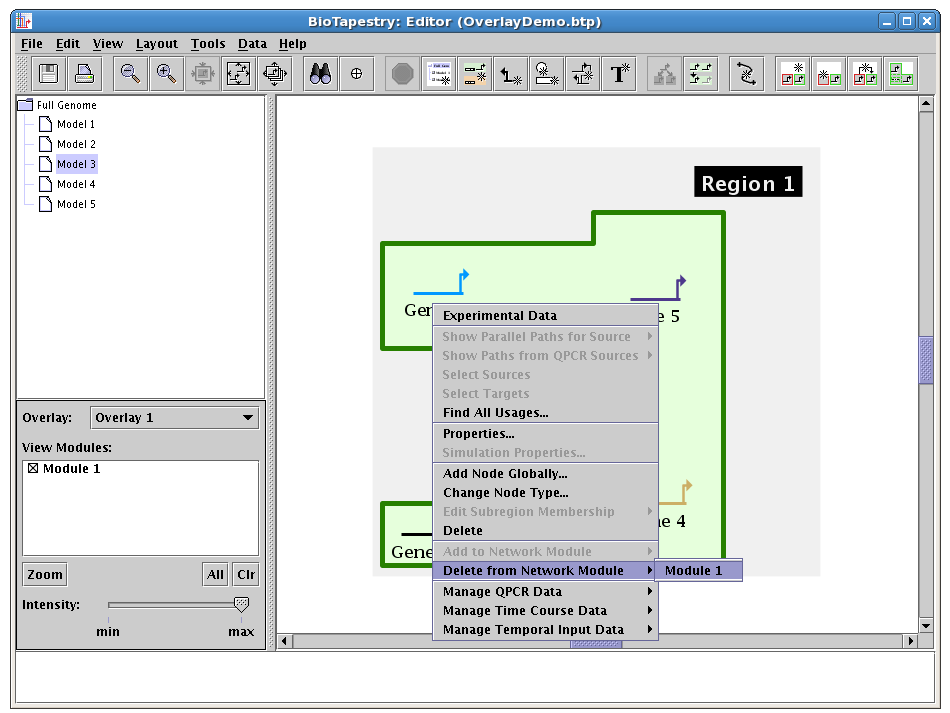
Finally, you can also right-click on a node or gene at any time and edit the module membership (adding or deleting):
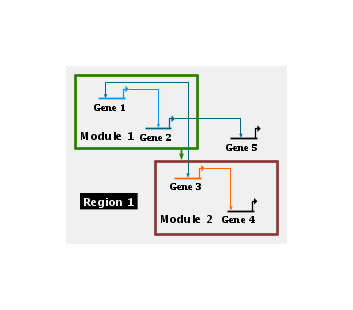
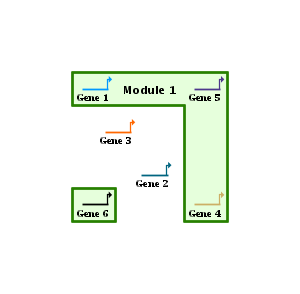
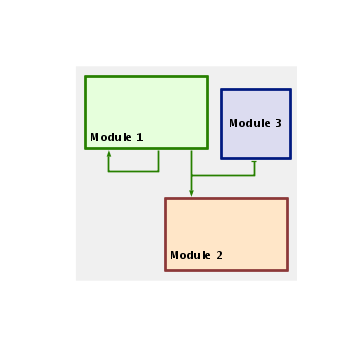
You can draw links between modules in a manner similar to drawing links in a network, and right-clicking on a network module link provides a pop-up menu for modifying the link in a manner similar to "regular" links. The biggest difference is that a module is not restricted to having only one tree of outbound links, since this would give very poor results as modules get very large and widespread, e.g. as in Module 1 below:
The software is designed to insure that as you radically change module boundaries and move modules around, the links continue to stay attached to the revised module boundaries, preferably with as little shift as possible. However, at the present time, there is no support for automatic link layout of module links, and most network modification algorithms such as region expansion or compression are currently not handling network module links. These features are intended as future enhancements to BioTapestry.
Text notes are the preferable way to add short notes to your models. They can be different for each model (i.e. the model hierarchy is not enforced), and provide an interactive mechanism to display longer text descriptions in the text box at the bottom of the Editor window. While plain text nodes have sometimes been used for this purpose, it is better to use nodes only to display actual network elements.
Version 4 has some new features to improve the utility of text notes:
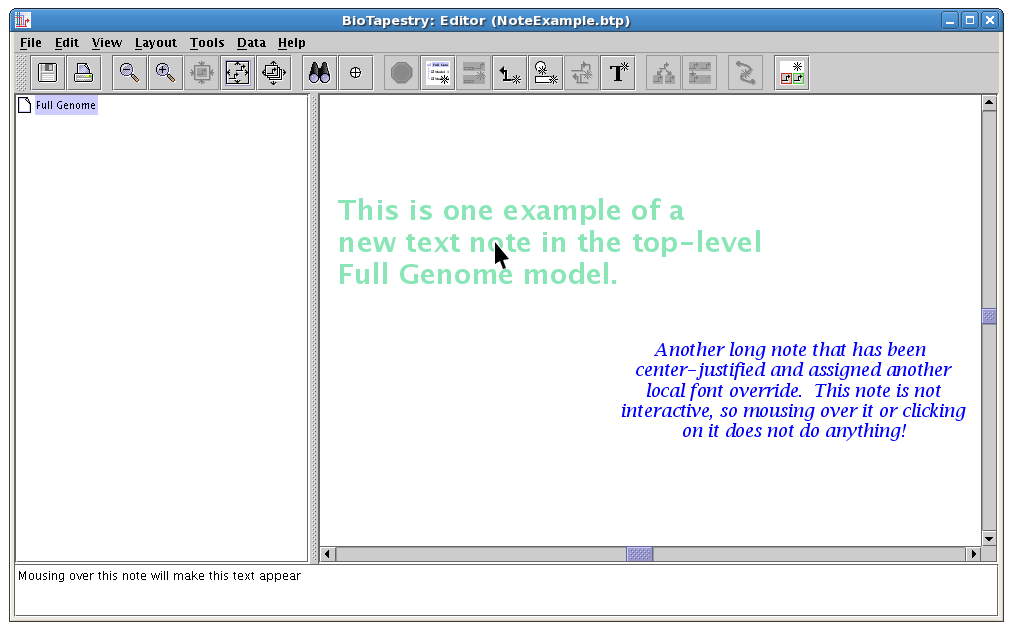
The following screen shot shows how multi-line notes can be customized with different fonts, colors, and justifications. Note how the left note has mouseover text showing in the message window at the bottom. The right note is not interactive, and so there is no mouseover message:
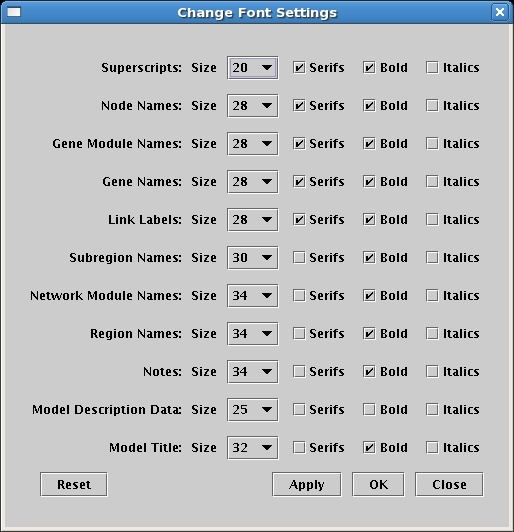
Fonts names are now descriptive of how they are used (e.g. Node Names or Region Names instead of e.g. Large Size), and there are more font categories available to target each specific use. Also, italic versions of each font are now supported:
The global setting for a given font can now be overridden locally in many instances, allowing the user to customize the font for individual cases. For example, the global Gene Names font values can be overridden for a particular gene, so the gene's name can be shown in a smaller font:
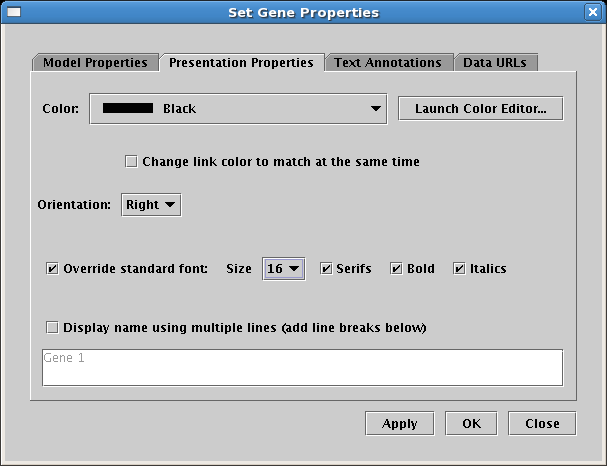
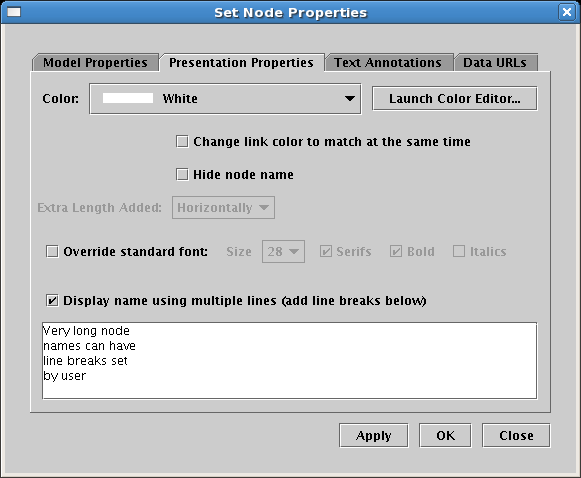
The example below shows the effect of the above font override for Gene 1. Also, it shows how the user can now specify how very long node or gene names can have line breaks explictly specified; previous versions did not provide any control over this:
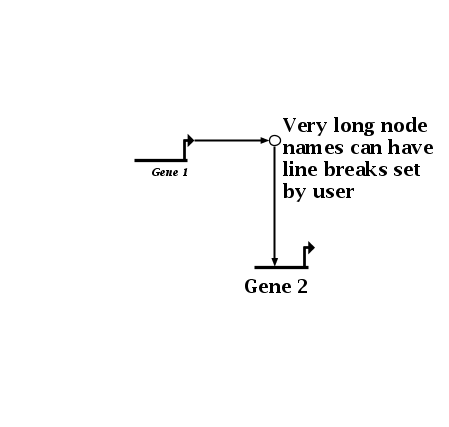
To set the line breaks, you just need to check the box at the bottom of the Presentation Properties tab in the node or gene Set Properties dialog, then insert returns into the name in the window below. (The text box only allows you to insert or delete line breaks; you cannot change the actual text of the name here; that is done on the Model Properties tab.) Note that plain text and box nodes still only provide a single-line presentation style (they have never had automatic linebreaks inserted):
Finally, the rendering of text by BioTapestry has been improved. The length of text strings used to vary slightly when viewed at different magnifications, which resulted in magnification-dependent layout inconsistencies. The names of network elements are now presented consistently at all the different zoom levels.
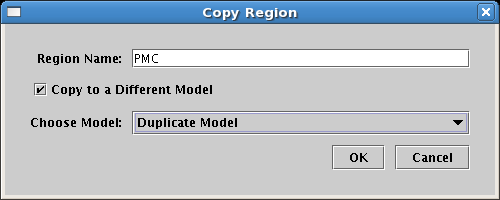
In the previous version of BioTapestry, you could right-click on a region, select Duplicate Region... from the popup menu, and create a copy of the region in the current model. Starting in Version 4, you have the option of specifying another model to receive the copy. The figure below shows how you check the Copy to a Different Model box and then choose the target model. Note that region copying is only supported in the immediate child (i.e. top-level instance) models of the Full Genome root model, and not in submodels further down the hierarchy, so the list of target models is limited to this set:
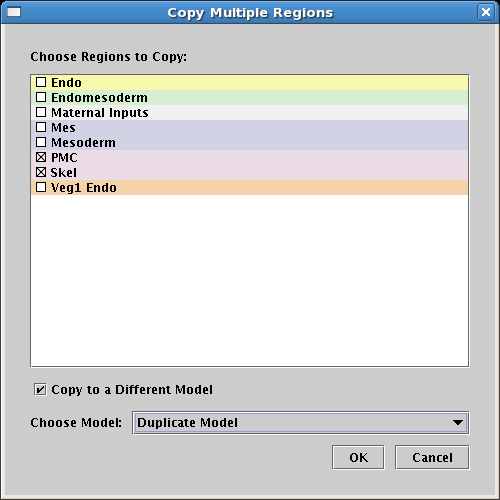
In addition, multiple regions can now be copied simultaneously, either within a top-level instance model, or between two such models. The biggest advantage of this approach is that it preserves any links between the regions during the copy. When one region is copied, only the intra-region links are retained in the copy. To access this feature, choose Edit->Copy Multiple Regions... from the root menu. In the Copy Multiple Regions dialog, check the regions to copy in the list and then choose the target model:
Starting in the previous Version 3, BioTapestry could be run in a batch mode, which allows a user to execute the program from a command line, without popping up an application window, to perform tasks such as converting a comma-separated value (CSV) input file into a set of image files of an automatically laid-out network heirarchy. Version 4 introduces an entry point that allows a Java program to call BioTapestry in this headless mode, where BioTapestry reads from a provided input stream and writes to a set of provided output streams. Furthermore, it gives the calling program a way to limit image generation to a limited set of specific models in the CSV definition file, and also provides mappings that allow the caller to do intersection testing on the generated images to find out which network nodes have been selected by e.g. a user mouse click inside the image.
It is anticipated that this code will be used to create web sites that provide interactive network exploration using just a web browser. To find out how this
interface can be used, developers should look at the small example provided by the org.systemsbiology.biotapestry.app.ImageGeneratorAppTestWrapper
class in the BioTapestry source code.
A variety of tweaks have been made to improve the user interface. Some of these changes are:
The BioTapestry source code base has had Gaggle support built in for some time. Starting with Version 4, a live Java WebStart link to launch a Gaggle-enabled instance of BioTapestry is now available off the BioTapestry home page.
Starting in Version 4.0, the bundled Help System had to be dropped due to ongoing compatibility problems with recently released Java versions. Since the material was not being kept up-to-date (the online documentation is being given the highest priority), this will hopefully be a minor inconvenience. The same material that was included in the system is still available in this PDF file.
Last updated: September 5, 2023
biotapestry at systemsbiology dot org