|
|
|
|
|
|
|
|
Version 5.0.3 was released on 09/06/12. Changes include:
Version 5.0.2 was released on 02/02/11. Changes include:
Version 5.0.1 was released on 11/24/10. Changes include:
The storage, input, querying, and management of perturbation data has been completely overhauled. Based on experience, several shortcoming in the previous system had been identified:
With the new implementation:
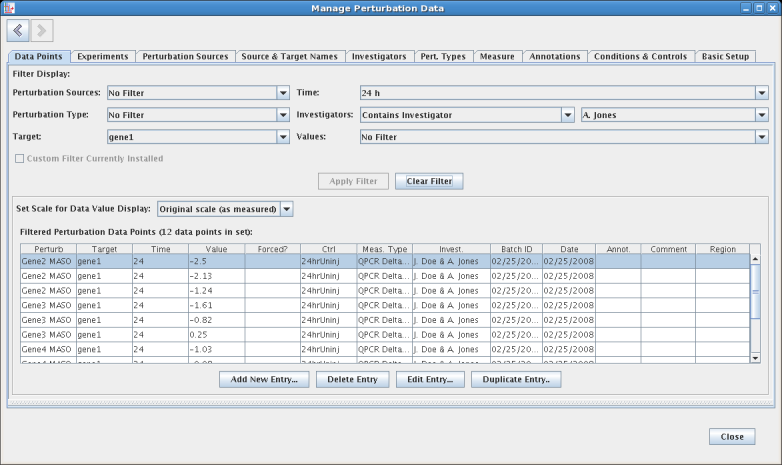
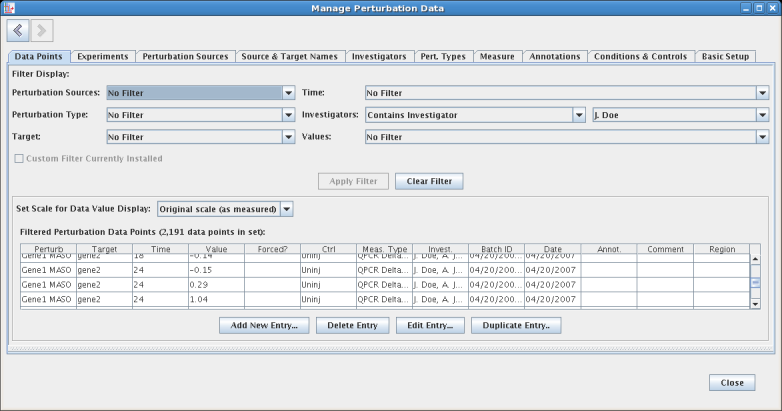
There is now a single, multi-tabbed perturbations management worksheet that allows the user to query and explore the data through filtering and multi-column sorting. It can be accessed by selecting Data->Perturbation Data->Manage Perturbation Data.... It can also be accessed by right-clicking on a gene and selecting Manage Perturbation Data->Edit Perturbation Data... from the pop-up menu; in this case, the data shown will be filtered to show only the data with the given gene as a the target. Here is an example of the management window with filters set for target, time, and investigator:
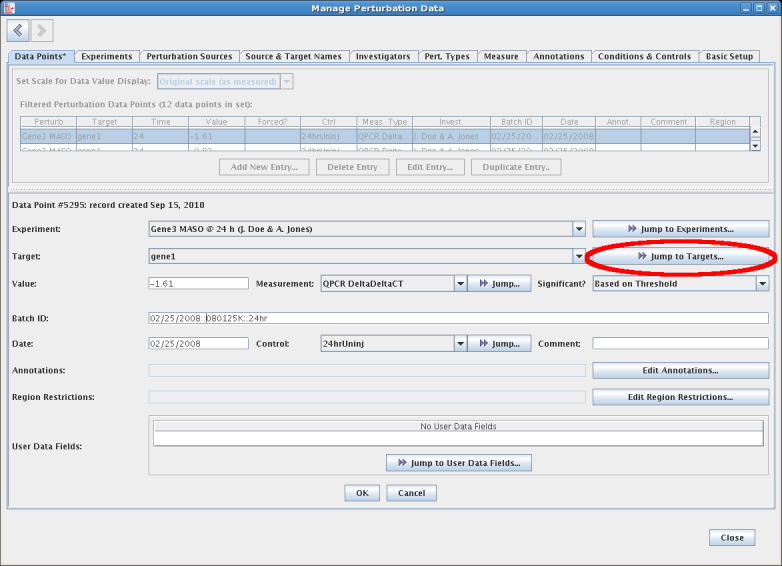
This same worksheet is used to edit and manage the perturbation data set. For example, by selecting a data point and clicking the Edit Entry... button at the bottom of the data points table (see above), the lower portion of the display is changed to show an edit form that provides detailed information on the data point, as well as the option to edit it. Note that most fields are choices between a existing set of controlled options, as opposed to free-form text. This approach of using a controlled vocabulary significantly reduces errors. But whenever the user needs to add a new choice while editing the data point, the Jump... button adjacent to each drop-down choice provides a quick way to access and edit the list of choices before returning and continuing the ongoing editing session. For example, you can click the Jump to Targets... button while the Target value is set to gene1:
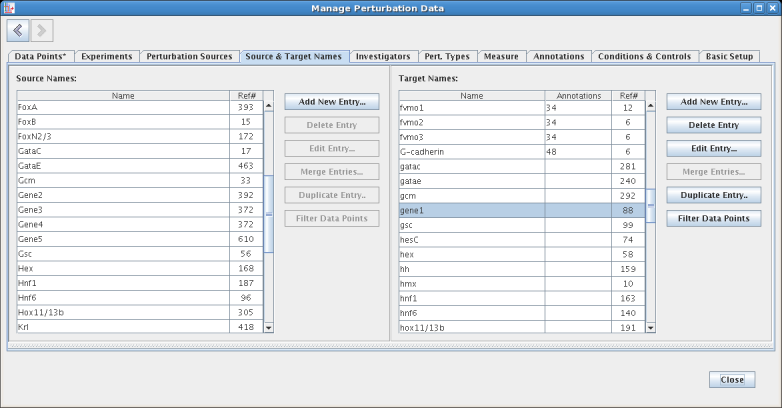
The display then jumps to show the Source & Target Names tab, with the gene1 entry selected in the Target Names table. Clicking on the < (back) button in the upper left corner would take you back to the ongoing edit on the Data Points tab; note how that tab display an asterisk to indicate a pending edit. In general, the tabs are arranged so that the basic definitions are on the far right, and moving through the tabs going back to the left define entities that have dependencies on more rightward tabs:
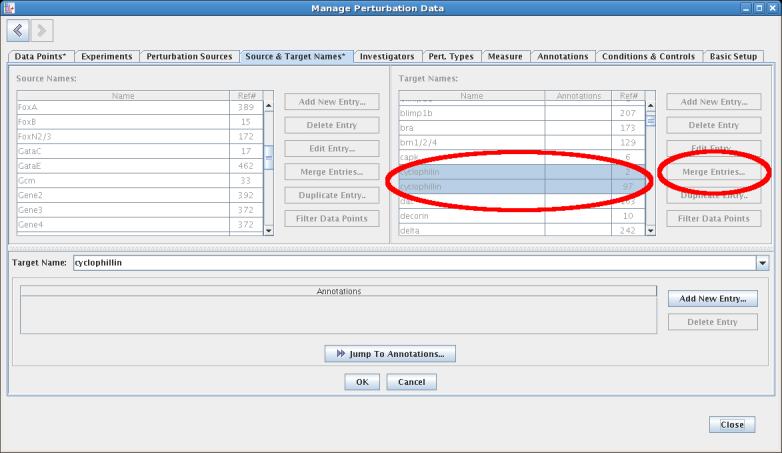
Another useful feature allows synonymous entries (e.g. two entries with different spellings referring to the same thing) to be merged together into a single name, with all the corresponding references to these multiple entries correctly fixed up to refer to the single merged value:
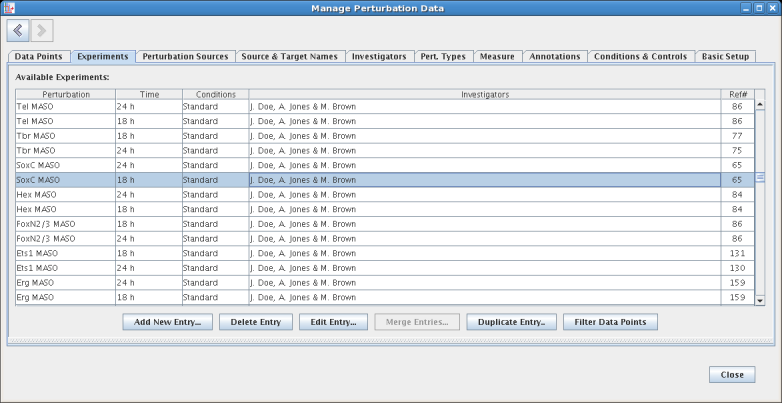
The ability to sort tables on columns helps to interpret the data and keep things organized. The following example shows the Experiments tab where the user has clicked on the Investigators column for a primary sort, then Ctrl-clicked on the Perturbation column to do secondary sort on that field. Note also how most tables display a reference count (Ref#) that show how many times the data element is being used. In this case, there are 65 data points for the selected SoxC MASO experiment at 18hr by the three listed investigators:
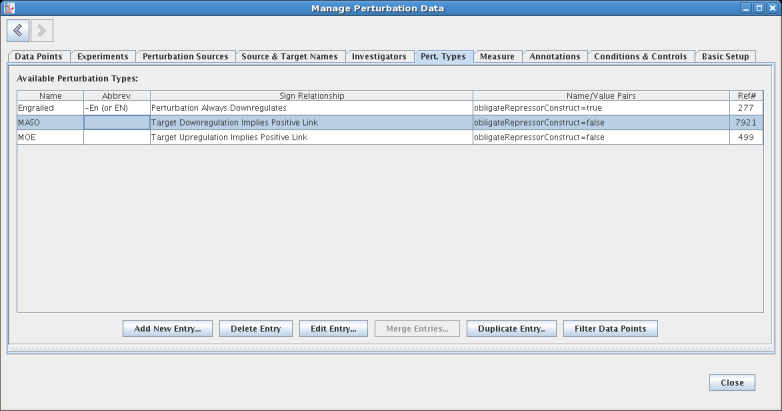
On the Pert. Types tab, the user can define their own perturbation types. These definitions include the specification of the sign relationship between the perturbation and the network link sign, as well as the ability to define arbitrary name-value pairs:
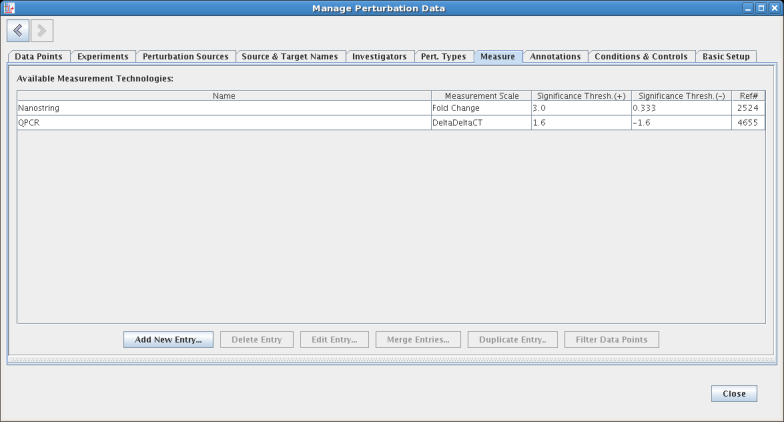
The Measure tab is where measurement technologies are defined. These technologies specify a measurement scale, as well as the significance thresholds:
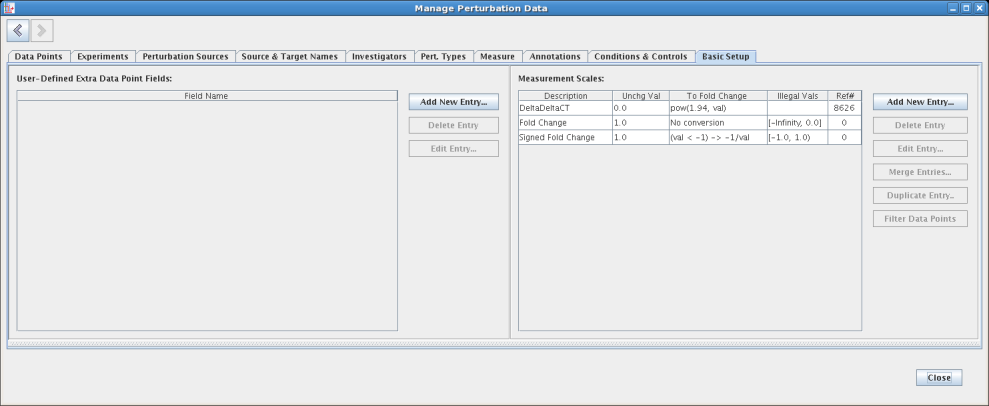
The Basic Setup tab is where both user-defined extra data point fields are created, and measurement scales are defined. Three scales (DeltaDeltaCT, Fold Change, and Signed Fold Change) are provided by default. Each scale has a conversion to Fold Change defined so that mixed data can be compared directly:
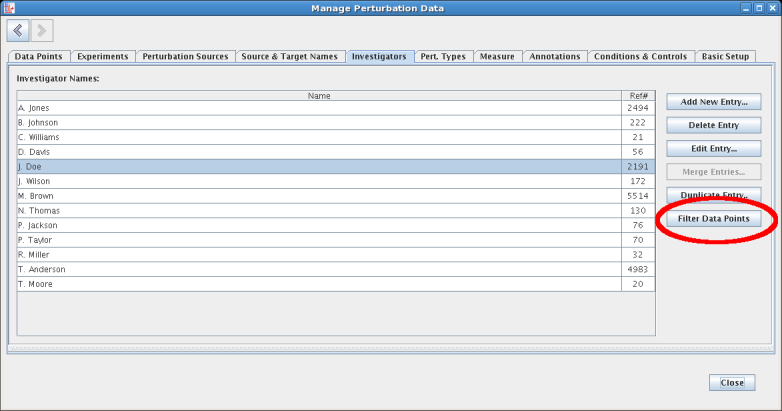
Most tables provide a Filter Data Points button, which is enabled whenever a table entry is selected. Clicking on the button jumps the user to the Data Points tab, with a filter installed to show just those data points that reference the selection:
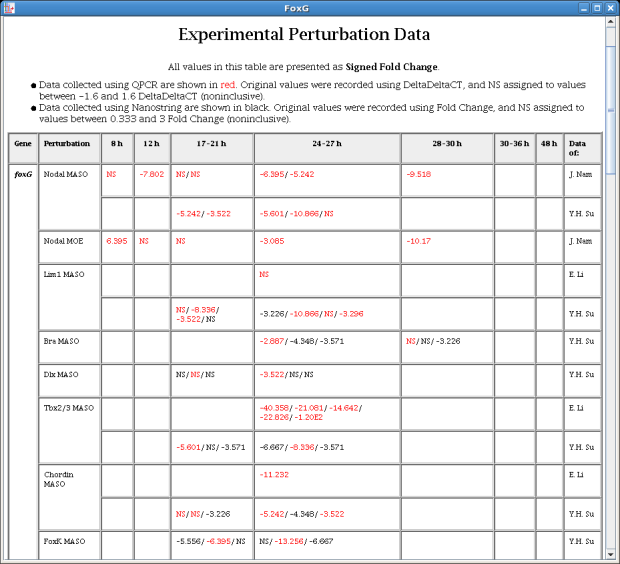
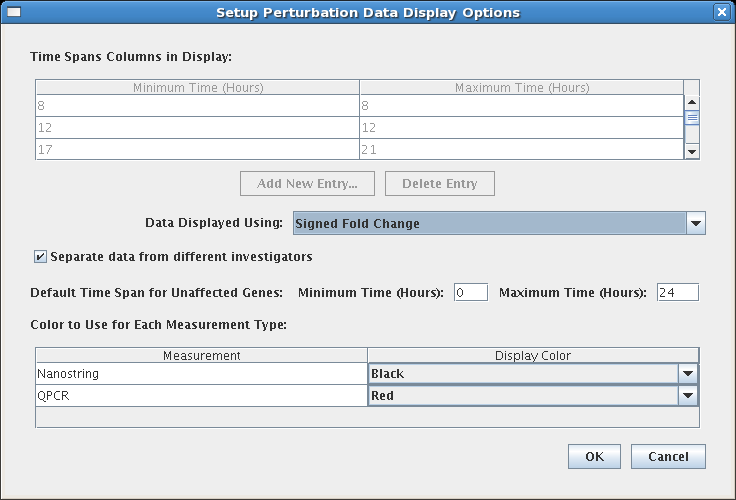
The existing perturbation experimental data display for genes and links has been upgraded with several improvements. The user can choose the units to use for display (here, Signed Fold Change), color code the measurement technology (here, red for QPCR, black for NanoString), split measurement sets by investigator, and reconfigure the time columns in non-legacy cases. The table also sports improved formatting and interspersed column headings:
To configure the above display, select Edit->Set Display Options..., and then click the Setup Perturbation Data Display Options button at the bottom of that dialog. This brings up the configuration dialog:
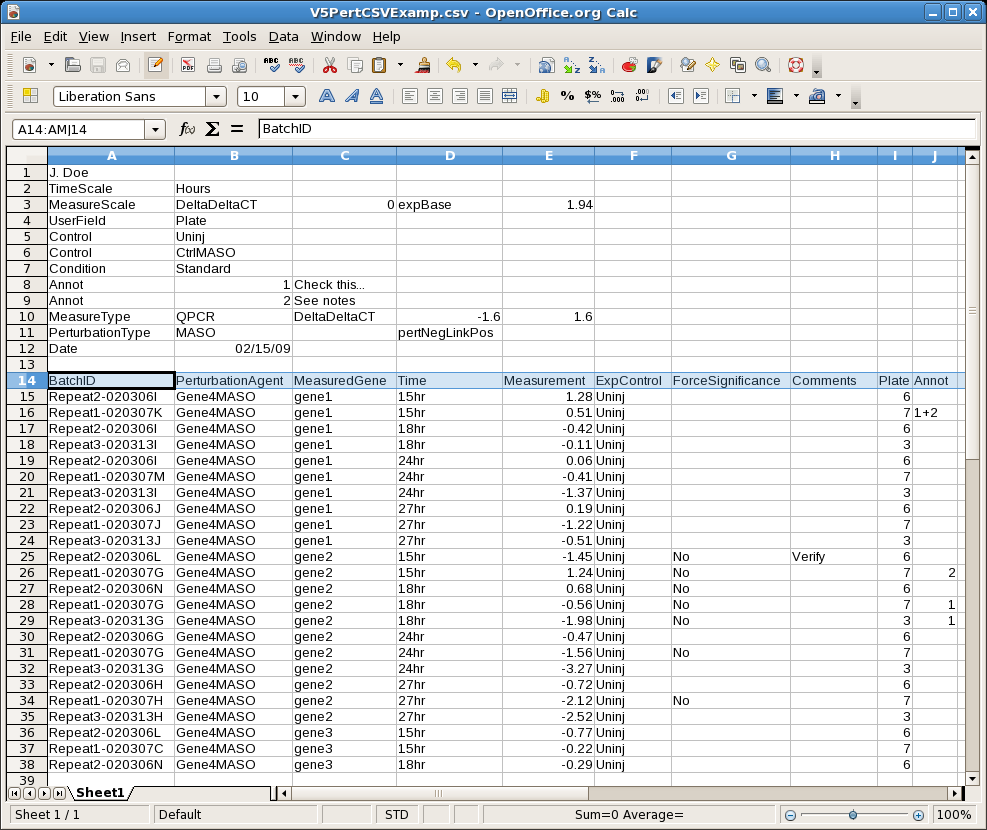
The comma-separated value (CSV) input format has been improved to provide more flexibility and support the new perturbation data framework. While both of the older input formats have been retired, upgrading files from the last previous version format should be straightforward, and mostly involves adding a few parameter lines at the start. For example, parameters that were hard-wired and assumed in the previous version (e.g. MeasureScale, MeasureType) now need to be explicitly provided. One important improvement is that multiple blocks with different parameters can now be included in one single file (this figure below only shows the first of several parameter/data blocks in the file):
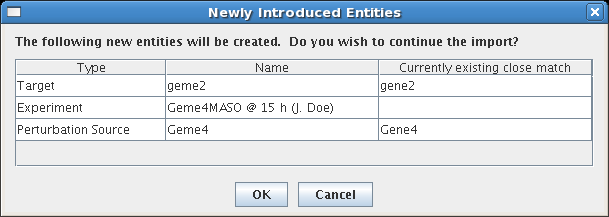
Based on experience, problems with spelling differences and slight variations in naming schemes can be very problematic when importing data. While the new data management system is designed to simplify recovery from these problems after the fact, the import process now looks for new entities before the import occurs and flags these possible problems:
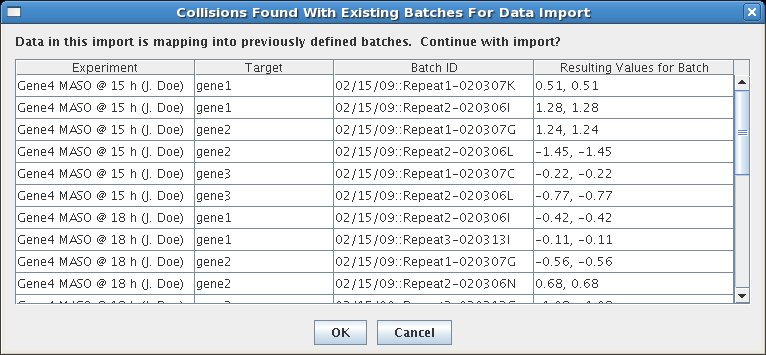
Another error that the system looks for is multiple imports of the same data. When subsequent CSV imports contain matching experiments with batch IDs that are duplicates of previous imports, the system provides a summary of these cases and allows the user to check that everything is in order before the import proceeds:
In addition to the overhaul of the perturbation data system, several new features have been added to Version 5 to improve usability and add functionality.
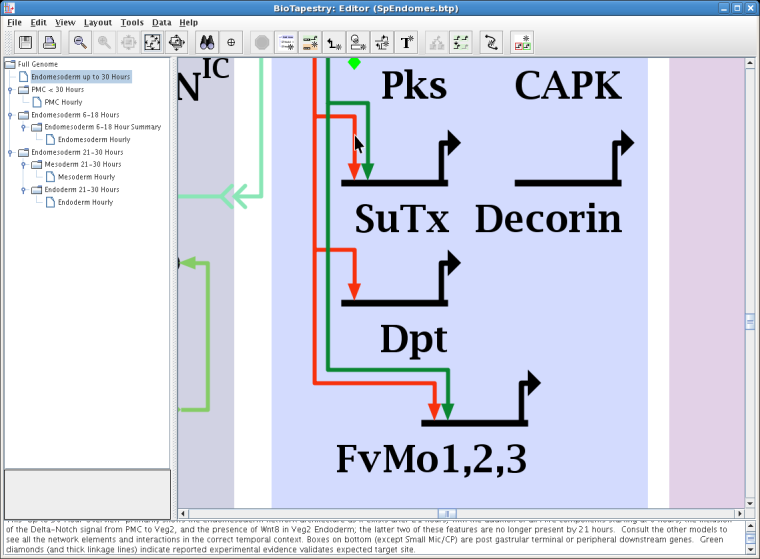
In previous versions, evidence to support a link in the network was accessible only by choosing Experimental Data for one of the endpoint genes (typically the target). Starting in Version 5, the evidence supporting a link can now be associated directly with that link. Just like with nodes, you can specify plain text as well as URLs to display for the link, in addition to the relevant perturbation and expression data that are provided by default. Just right-click on the link and choose Experimental Data for Link from the top of the pop-up menu. The preferable way to do this is to click on the link just above the target gene, since that link segment is unambiguously dedicated to the single link in question. For example, the cursor below is directly over the red link landing on SuTx:
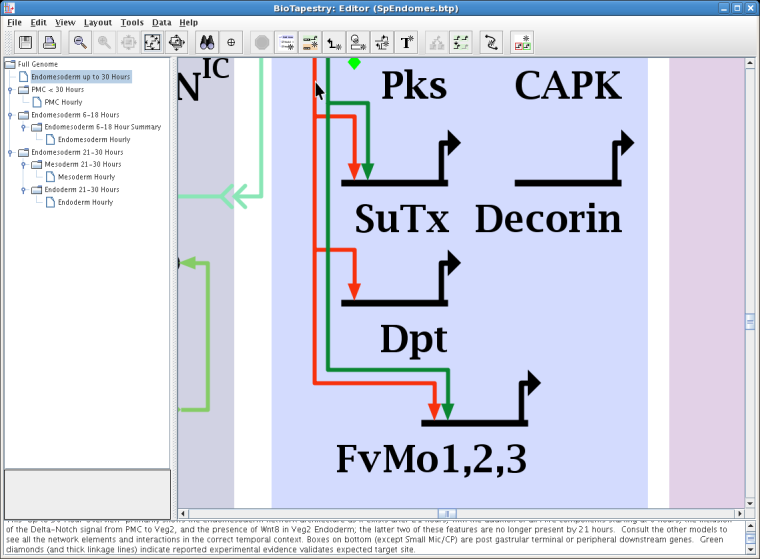
If instead you choose another link segment that has multiple links "passing through" it, you will then need to specify which single link you want to view using a dialog before the data window appears. For example, it is possible to right-click on another red link segment, which supports three links to different targets, as shown below:
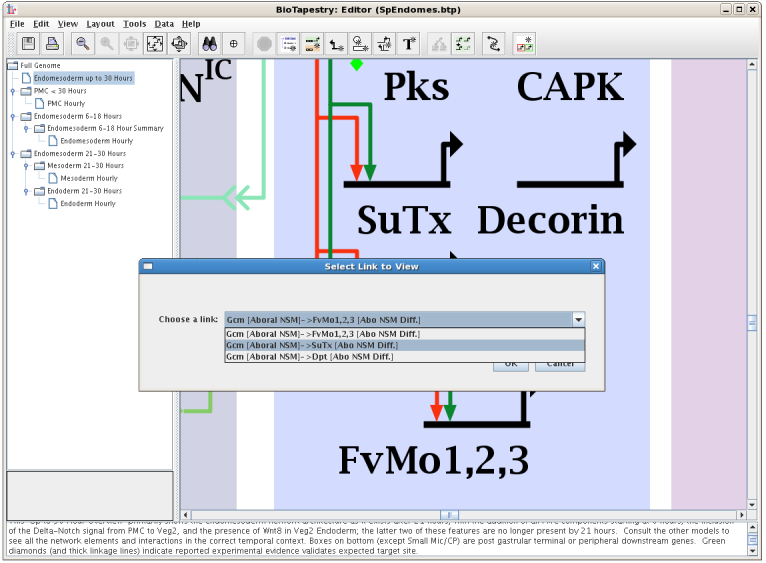
But in this ambiguous case, after selecting Experimental Data for Link from the top of the pop-up menu, you need to identify which of the three links you want:
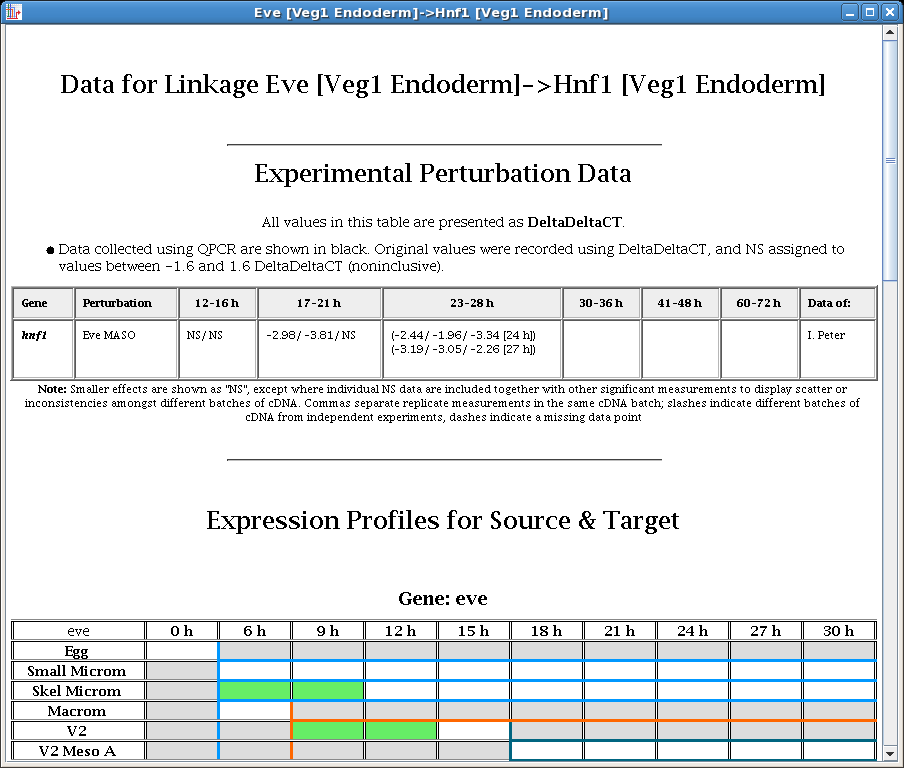
In this example of the experimental data display for a link, note how the perturbation data displayed is limited to just the data relevant to the link source and target. Also, expression tables are shown for both source and target:
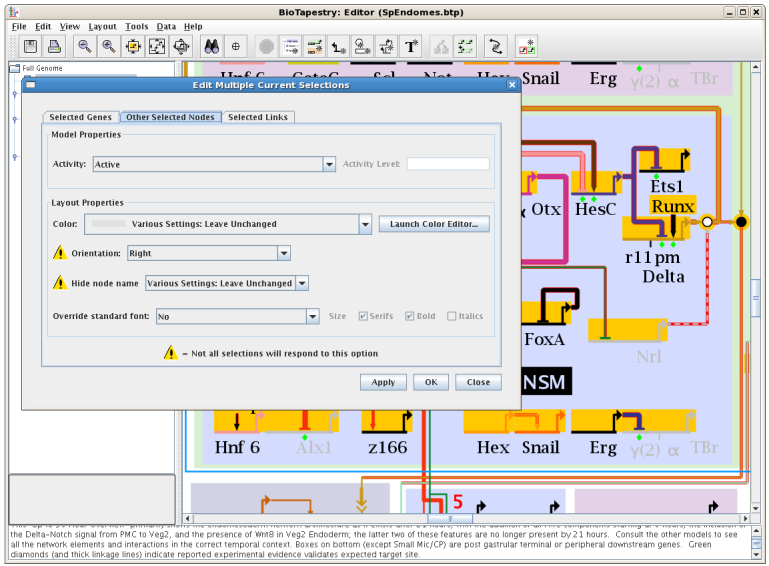
In previous versions, the only way to change the properties of a node or a link was one-at-at-time. Starting with Version 5, the properties of multiple selections can all be changed simultaneously. First select multiple genes, nodes, and/or links by using Shift-clicks with the mouse, rubber band boxes, or other multi-selection methods such as search. Then choose Edit->Edit Current Selection->Edit Multiple Current Selections..., which brings up a dialog box with up to three tabs: Selected Genes, Other Selected Nodes, and Selected Links. Options that are currently set to different values will be tagged as Various Settings: Leave Unchanged; these can either be left untouched, or all set to a single uniform value for all the selections. Note that not all option settings may apply to all the selections, and these are flagged (as shown):
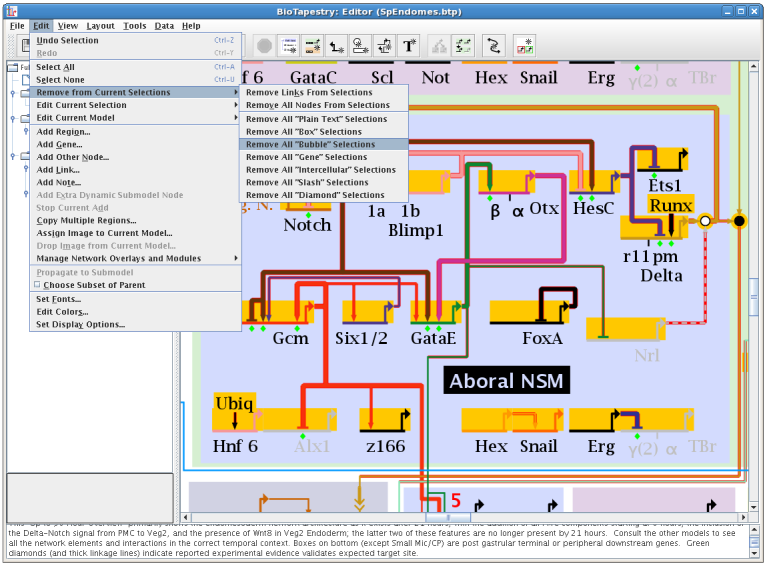
Since multi-item selections can now be modified as a unit, it is desirable to provide more control over the process of pruning a selection set, and so Version 5 allows the user to toss out particular node types from the set, as shown here:
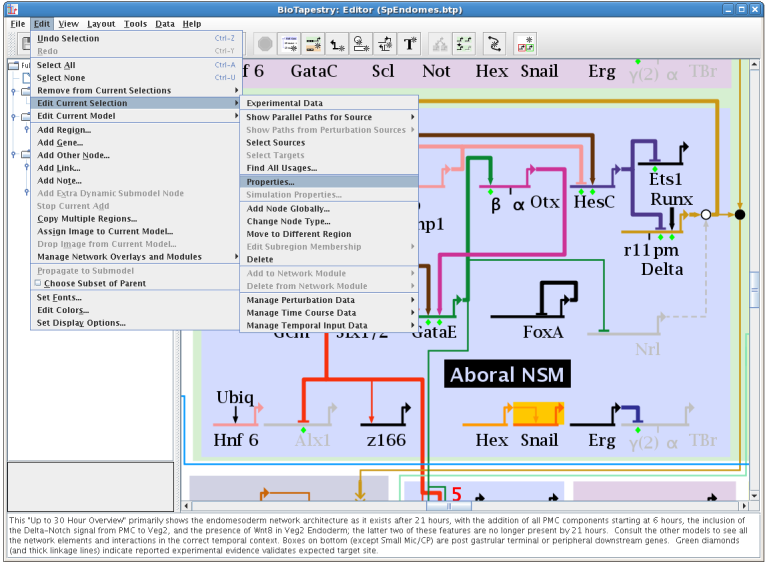
One long-term goal for BioTapestry development is to not require the use of mouse right-clicks to access important functions. Moving in this direction, it is no longer necessary to right-click on genes, nodes, or links to be able to access the context-dependent pop-up menu. Now, if just a single element has been selected, choosing Edit->Edit Current Selection will bring up the "right-click" menu for that selection. In a similar vein, choosing Edit->Edit Current Model brings up the "right-click" menu for the current model selected in the left-hand model hierarchy window. But note that items that are not currently selectable (text notes, regions, overlays, and network modules) still need to be right-clicked to access the menu:
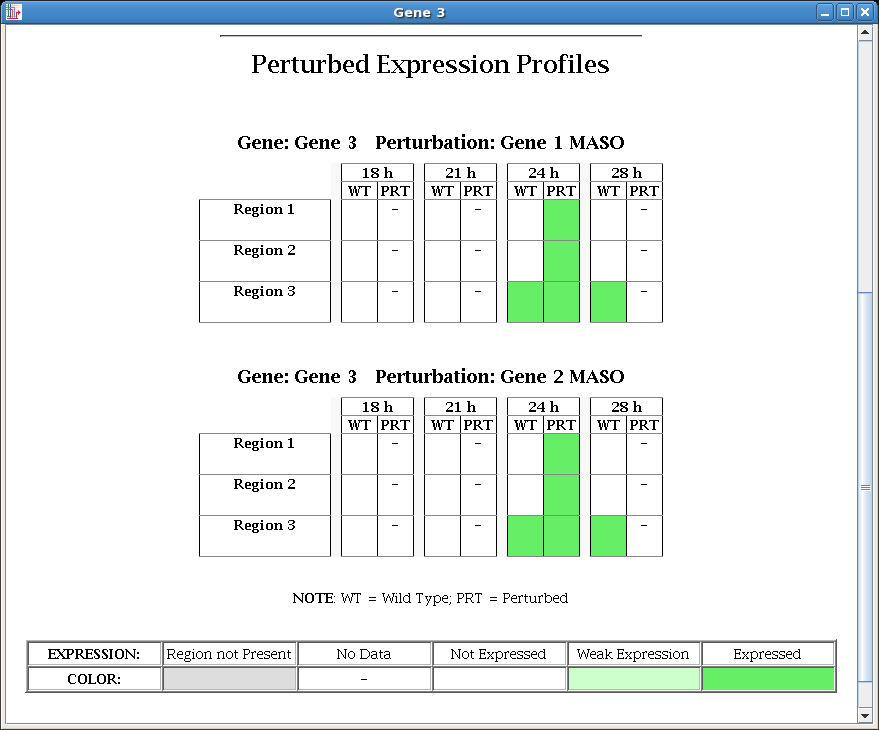
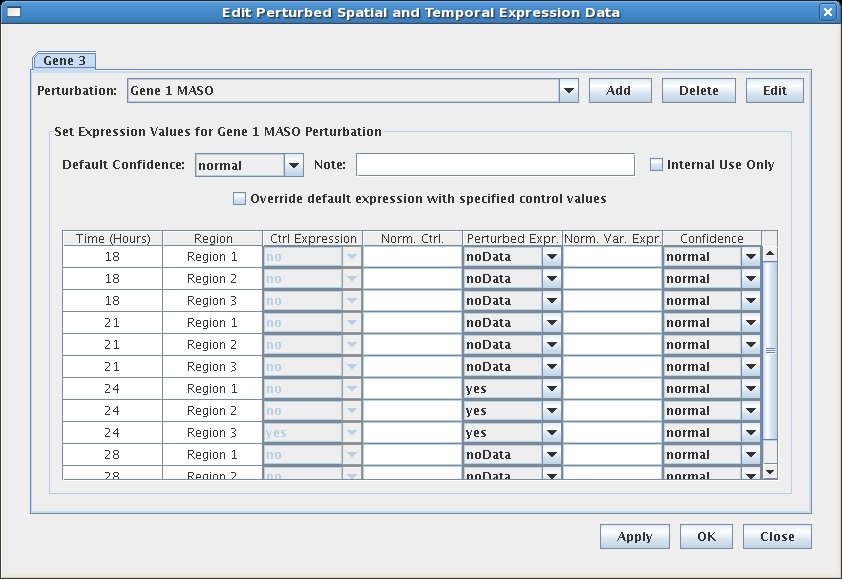
In Version 5, perturbed spatial and temporal expression data can now be input, stored, managed, and displayed, as an adjunct to the existing framework for working with the unperturbed wild-type expression data. Like the wild-type data, the perturbed data is displayed on the experimental data page:
To enter perturbed expression data, it is necessary to first define the relevant perturbations using the new Perturbations Management system described above. Specifically, there need to at least be definitions for:
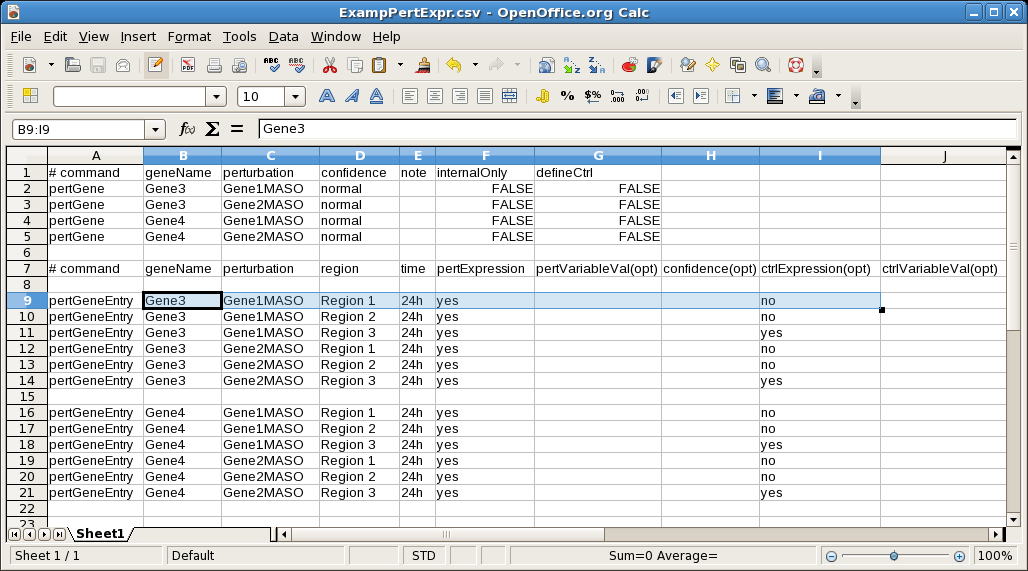
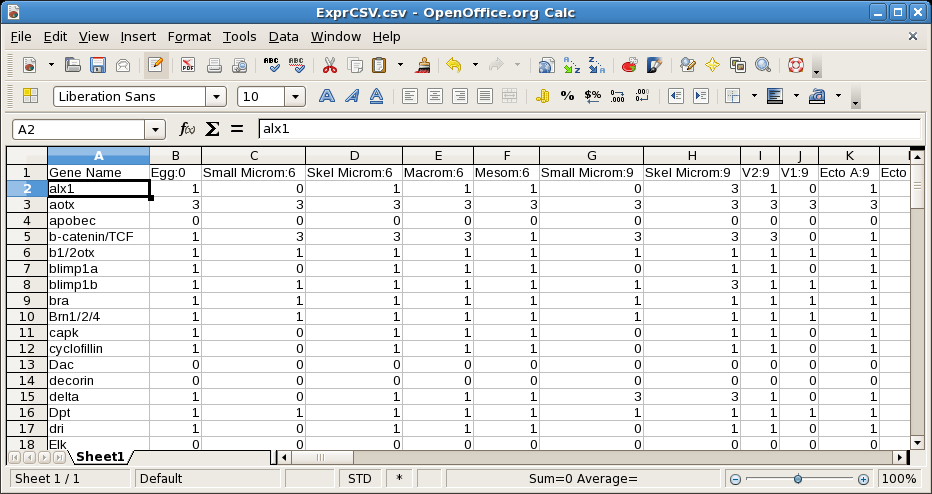
If large amounts of perturbed spatial and temporal expression data need to be input, then an alternative to import a CSV file with that information is also available; just select File->Import->Import Perturbed Expression CSV Data.... The following spreadsheet shows a small example of the supported format:
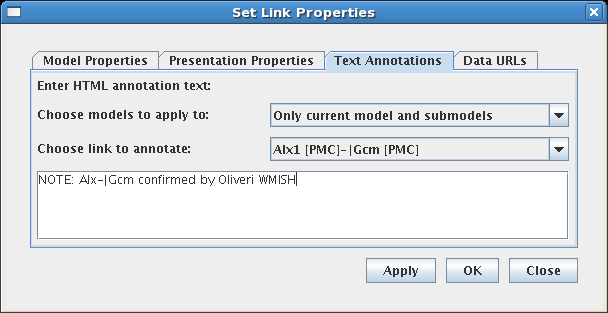
In previous BioTapestry versions, it was only possible to specify global text annotations and URL references for a gene/node; this same information was displayed for all instances of that gene/node in all models. Starting in Version 5, while globally shared information can still be specified as the default, it is also possible to specify unique data for each different gene/node instance in each top-level instance model (subset models below the top-level instance models display the information of their parent). And since Version 5 now supports entering these data for links too, this fine-grained level of control also applies to links. This feature is controlled using the Choose models to apply to option on the Text Annotations and Data URLs tabs in the properties dialogs:
Another improvement to the experimental data pages is that the data window now appears immediately after it is launched, while any (often delayed) information obtained via URLs is now collected in the background and displayed after it has arrived.
BioTapestry's spatial and temporal expression data tables can now be exported using a comma-separated value (CSV) file (i.e. the file is readable by spreadsheet programs such as Excel). To export the data, select File->Export->Export Expression Tables to CSV...:
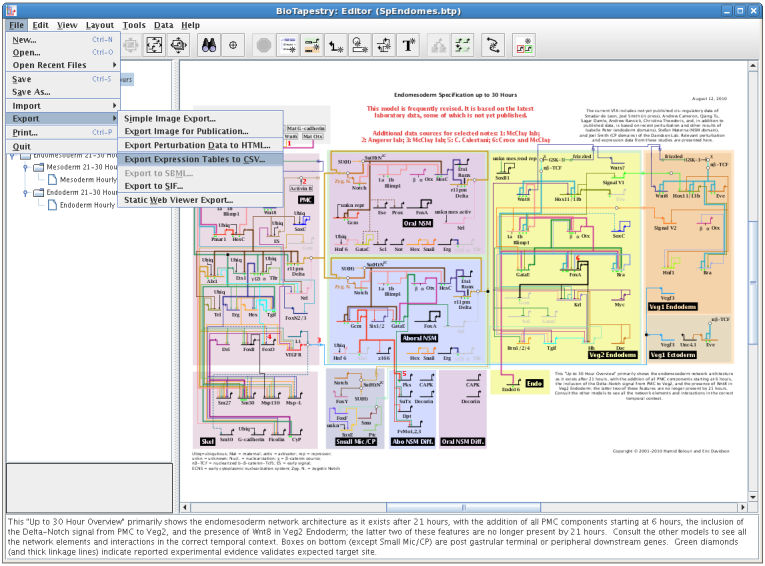
The resulting file uses a numerical code representing the expression level that is enumerated in a key embedded in the file. Columns can either be grouped by time or by region:
There have been several bug fixes. In particular, the Synchronize all Layouts, Bipartite Strategy, and Static Web Viewer Export command have all had important fixes.
The Export->Export QPCR to SIF and Tools->Build Root Model From QPCR Data commands were dropped as part of the conversion to the new perturbation framework. Also, as mentioned above, both the legacy and the previous QPCR CSV import formats have been discontinued.
Developers looking at the code base will note that a package reorganization has taken place
in the org.systemsbiology.biotapestry.ui package. The EditableTable
and ReadOnlyTable reflect a major refactoring effort to simplify and unify
JTable-related code. Also, progress was made on an ongoing effort to
refactor common code out of the various dialog box classes.
Classes in the org.systemsbiology.biotapestry.plugin package have also
been modified, with InternalDataDisplayPlugIn and
ExternalDataDisplayPlugIn classes being deprecated. Instead, now
use InternalDataDisplayPlugInV2, InternalNodeDataDisplayPlugIn,
and ExternalNodeDataDisplayPlugIn. Note also the introduction of the
PluginCallbackWorker interface to handle background threading of long-lived
data gathering requests.
Last updated: September 5, 2023
biotapestry at systemsbiology dot org