|
|
|
|
|
|
|
|
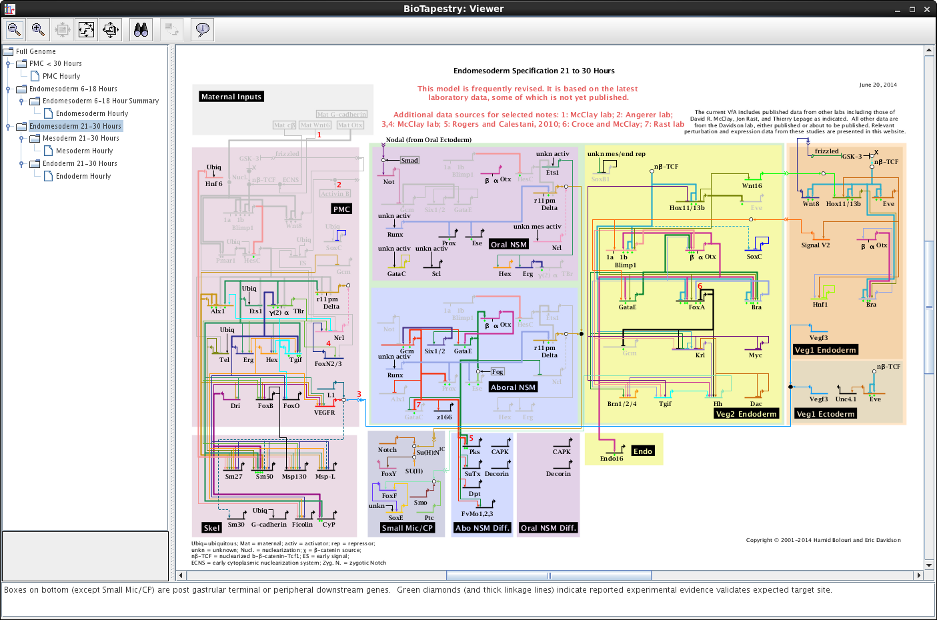
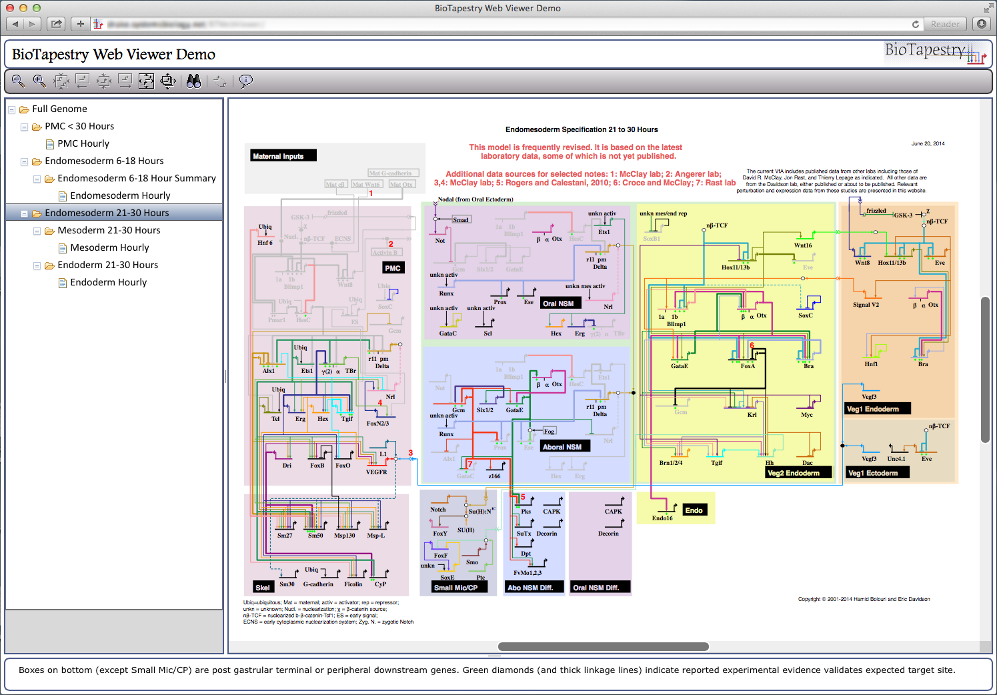
Since the beginning of the BioTapestry project, a major goal has been to provide an online interactive model viewer that can be used to explore complex gene regulatory network (GRN) models. For example, the existing Java-based BioTapestry Viewer has been used to provide an interactive online version of the sea urchin endomesoderm network since 2003:
However, it is becoming increasingly difficult to ensure that the current Viewer, which uses Java Web Start, will run correctly on the user's computer. Furthermore, current web-browser technologies such as HTML5 Canvas make it possible to provide an interactive graphical network model directly in a web browser without needing Java, so we have created a version of the BioTapestry Viewer using these technologies.
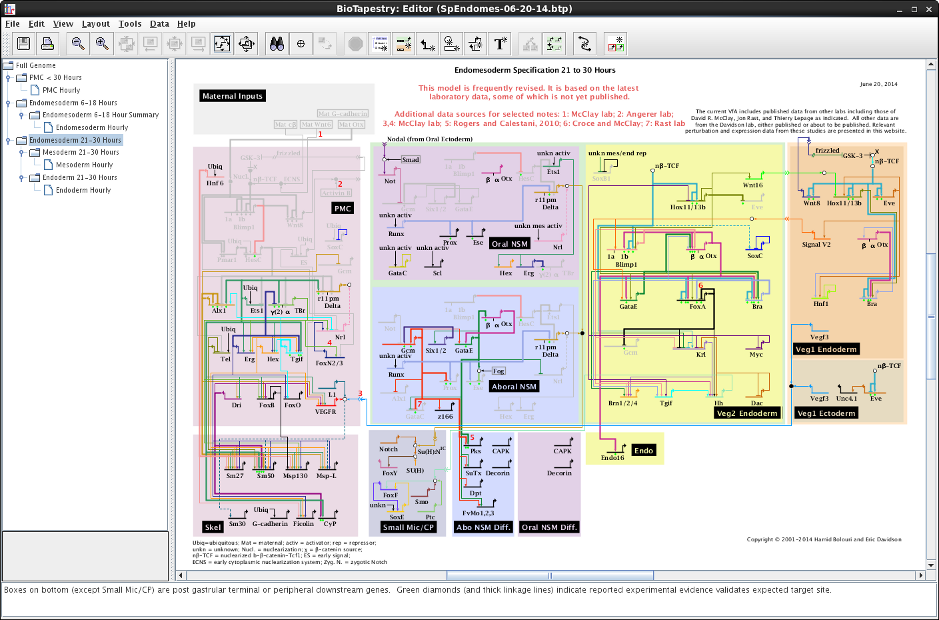
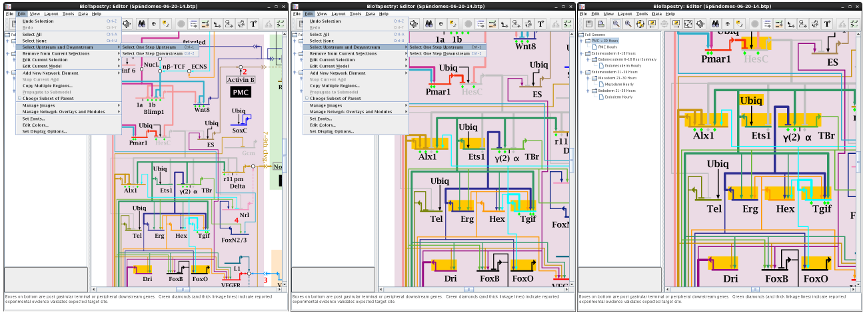
This goal has required a major redesign of the software architecture of BioTapestry. Yet the software continues to support the traditional desktop Java Editor application, and so users of the desktop BioTapestry Editor, shown here, should not notice any difference while using this new version:
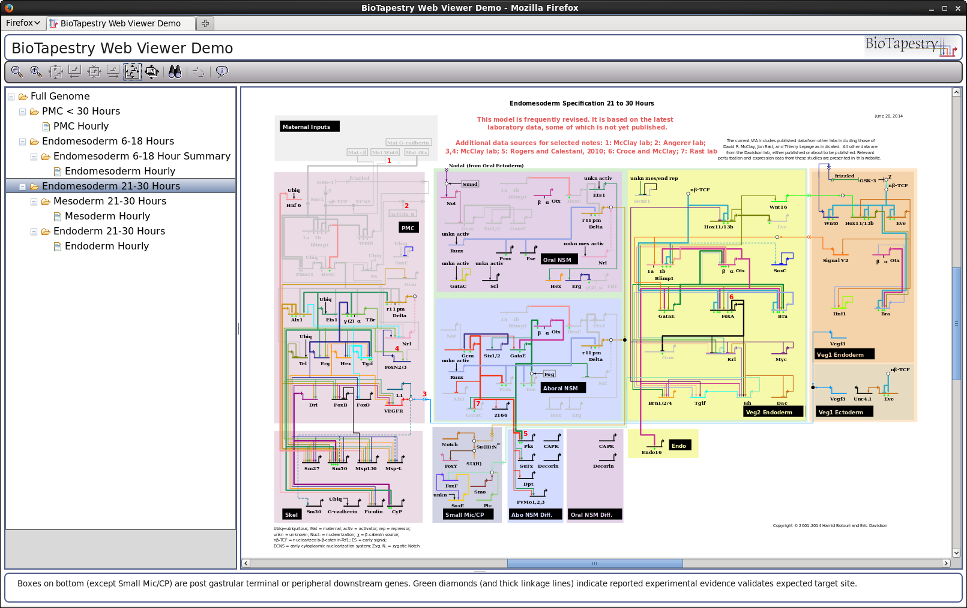
But now the same code also can be installed in a web server to drive the new browser-only web application, which replicates the features of the Java-only version. For example, this shows the Viewer running in Firefox on Linux (compare it to the screenshot at the top of the page):
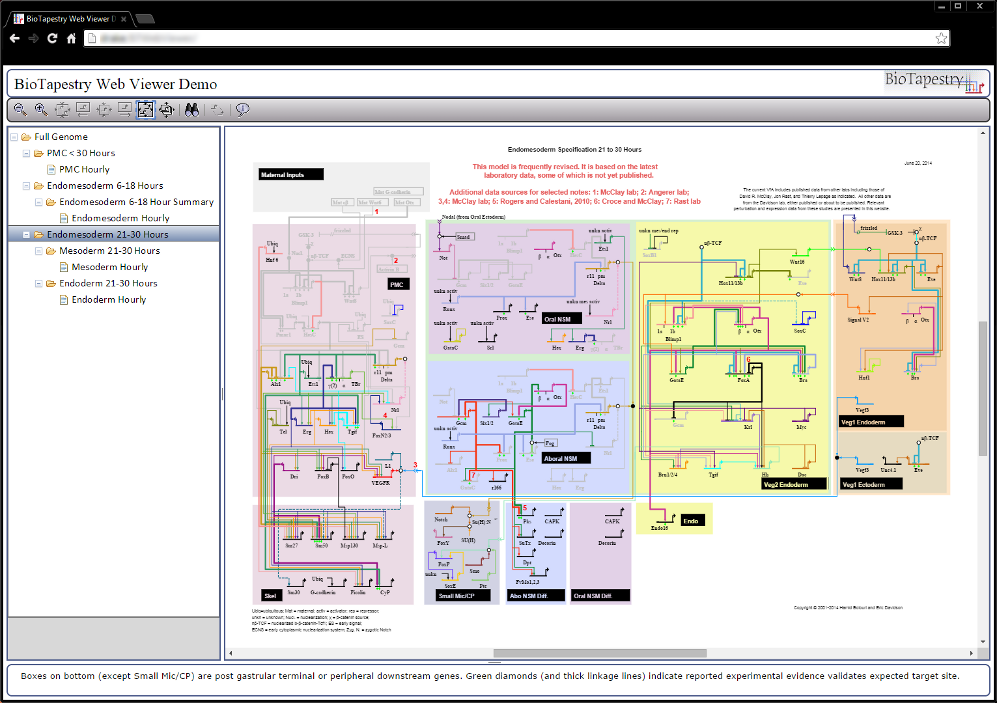
The browser-only Viewer is implemented using JavaScript, the Dojo Toolkit, and HTML5 canvas, while the component on the web server is built using Java Servlets. This combination allows for excellent cross-platform compatability. For example, here is the Viewer running in Safari on Mac OSX:
And here is Chrome On Windows. Of course, other browser/OS combinations (e.g. Firefox on Windows, Chrome on Mac) should work as well:
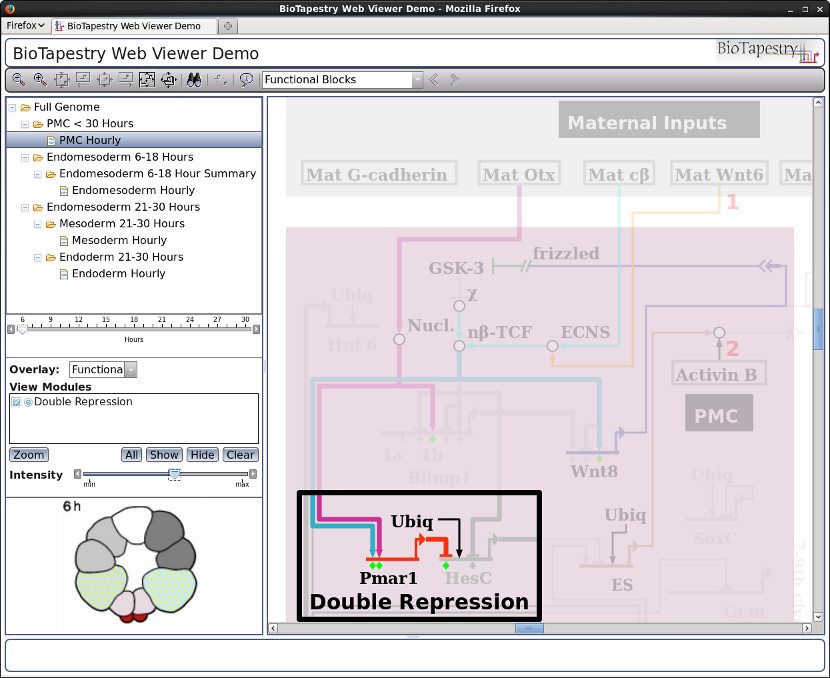
The browser-embedded Viewer has been designed to support all existing features, such as network overlays, model images, user tours, and so forth:
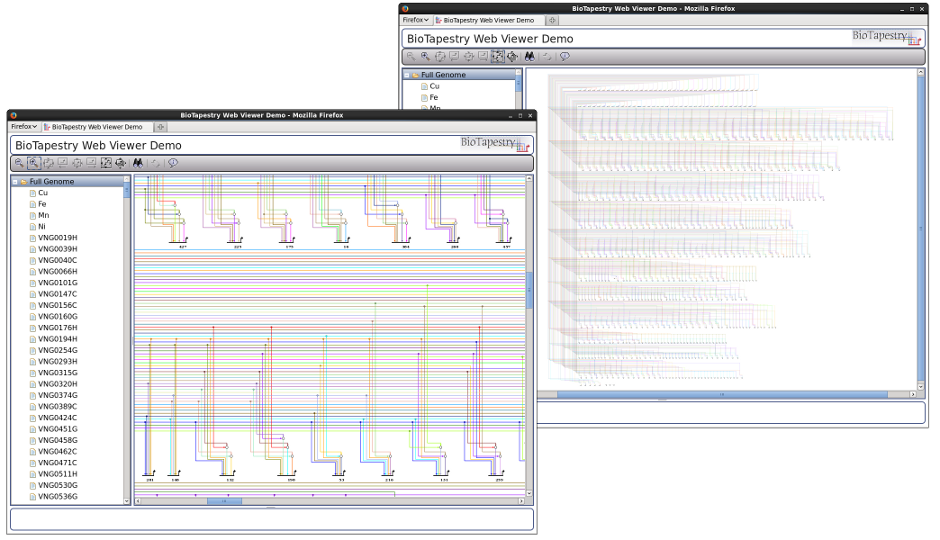
Finally, the new Viewer can handle reasonably-sized models. For example, this model has over 1000 nodes (including 531 genes):
To deploy the new web client viewer, you will need to install the software on a web server that supports Java Servlets. Briefly:
BTWebViewer.war file into the webapps/ directory of your Tomcat installation.http://YourWebServerName/BTWebViewer/
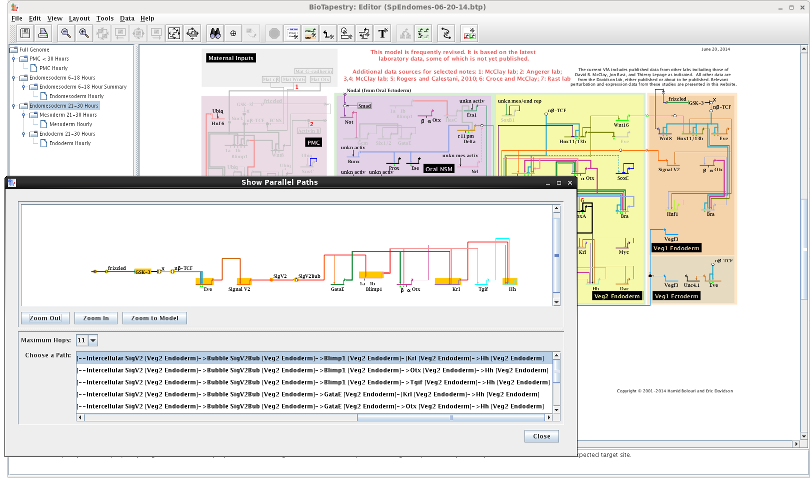
The Show Parallel Paths feature has been significantly improved. First, the layout of the row of nodes in the display has has been completely overhauled, and now uses the standard BioTapestry "gene-centric" auto-layout algorithm. This fix means that we can now provide a clean and rational routing of the links associated with non-gene nodes. The display has also been made "non-modal", so the user can still interact with the main program while also looking at the path display. Of course, the Viewer has supported the Parallel Paths feature for awhile, and the new browser-supported Viewer includes it as well. Here is a shot of the Parallel Paths display with the desktop Editor:
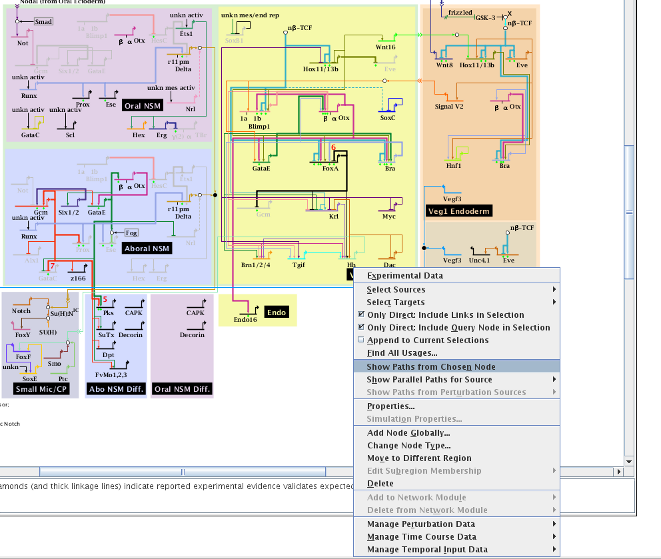
Additionally, the user was previously restricted to viewing parallel paths from either perturbation sources (if perturbation data had been loaded into BioTapestry) or direct sources. This restriction has been removed, and the user can now view parallel paths from any node by simply clicking on it. The system will then search up to a depth of 30 hops, if necessary, to try and find a path to show:
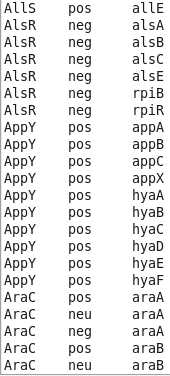
BioTapestry now has improved support for SIF file imports, which is the simple network definition file format used by Cytoscape. This basic format consists of lines with three fields of the form: "sourceNode[tab]linkTag[tab]targetNode"; lines with just a single field represent singleton nodes. Note that BioTapestry requires the tab-delimited version of the SIF format! BioTapestry can use this file to create a single top-level "Full Genome" network model, where each node is a gene. For importing more complex models, the user should use the CSV import format.
In previous versions, the link tag was completely ignored, and each link was given a positive sign. Starting in Version 7,
the tags pos, neg, and neu can be used to assign a positive, negative, or neutral
sign to the link. Additionally, the tags PROMOTES, REPRESSES, and REGULATES (respectively) can
be used as well; those are the legacy tags that are used with BioTapesty SIF file exports, so exported SIF files can be round-tripped
back into the program:
Version 7 also supports more layout flexibility with SIF imports, allowing the user to choose which automatic layout technique to use for the import (it was previously hard-wired). Note how now the resource requirements of the various alternatives are also presented in the dialog:
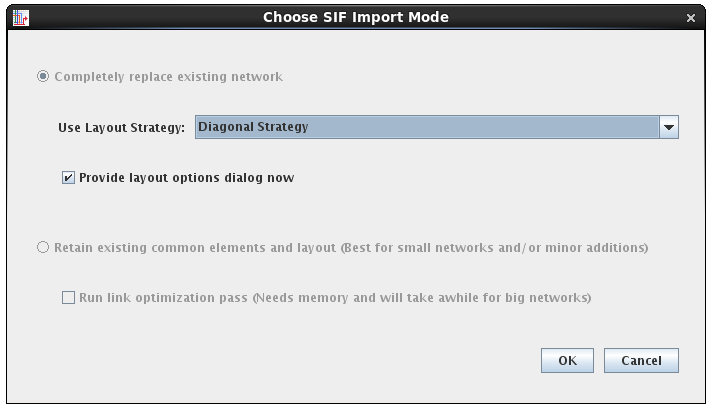
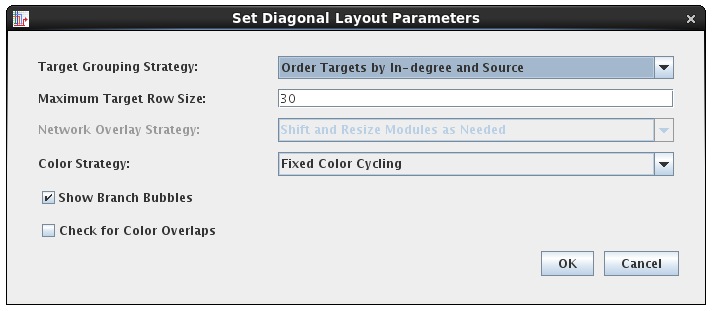
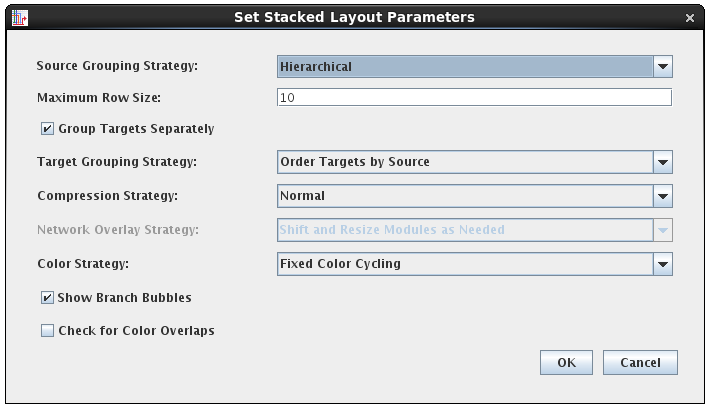
The user is also given the choice to set the layout options as part of the import (above), which brings up the dialog for the chosen layout strategy:
As with SIF, the CSV file import also supports more flexible layout options and tips about resource requirements:
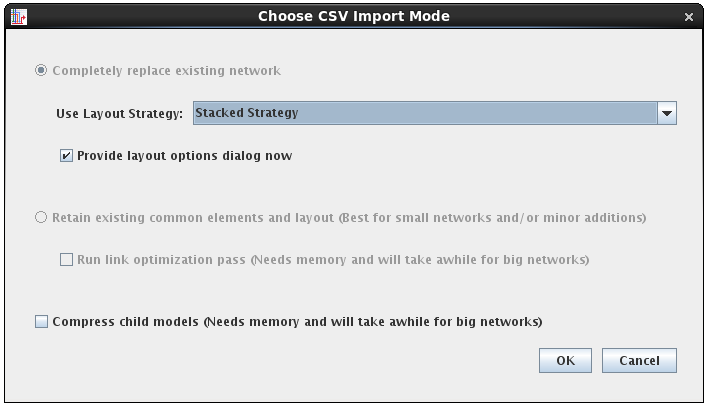
For many of the layout strategies, having direct control of the initial import layout can save lots of time when working with large networks:
Some of the layout techniques that have been explored in the BioFabric project have inspired new additions to BioTapestry as well. First, the Fixed Color Cycling color strategy was added. This strategy justs iterates though a cycle of colors while assigning link traces, just like BioFabric does. This can provide better (and faster) results than keeping the existing colors or trying to assign colors to avoid ambiguous crossings. Second, there are two new strategies for ordering target nodes: Order Targets by Source and Order Targets by In-degree and Source. These two strategies are similar to the existing Cluster by Inputs option in that targets with identical inputs are adjacent to each other, but the new techniques do a much better job of providing an organized global sequence for the target nodes. Briefly, you can view each vertical link trace on the left side of the target stack as representing a digit of a binary number, and then assign each target a number based on setting the corresponding input trace digits to "1"; thus each target now has an assigned binary number. The target nodes are then laid out in decreasing sorted order of these binary numbers, such that the source associated with the leftmost vertical trace will have its targets laid out first. For the second Order Targets by In-degree and Source option, node degree is used as the primary sorting criteria (highest first), with the binary input assigment technique is used as the second:
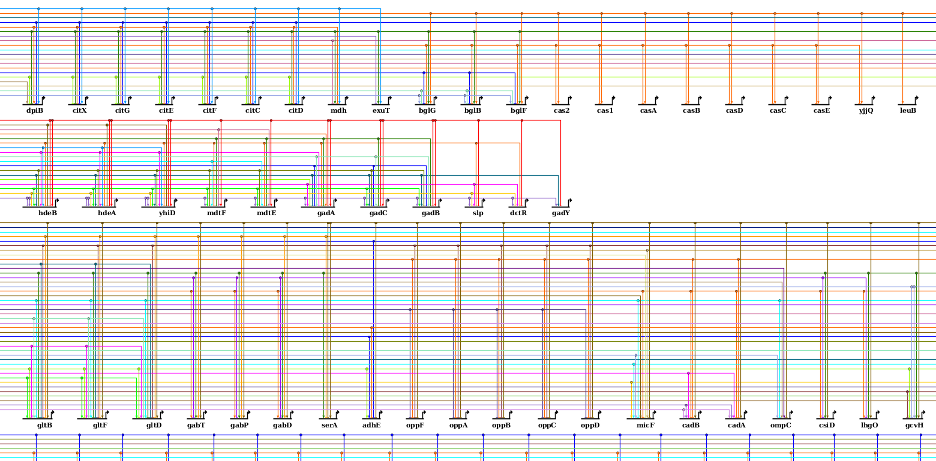
Since the layout and presentation techniques used by BioTapestry are highly scalable, it can be a useful visualization tool for networks containing thousands of nodes. Thus, considerable effort was expended to make the layout algorithms much more efficient, thereby making it practical to use BioTapestry for these networks.
It is often desirable to start with one or more nodes in a network, and then search upstream or downstream in the network step-by-step to accumulate the total set of upstream or downstream influences as node selections. You can now do this using the Edit->Select Upstream and Downstream menu. For example, we start here with two genes low in the network, and then take two steps upstream to select the set of genes within two upstream hops:
Last updated: September 5, 2023
biotapestry at systemsbiology dot org