|
|
|
|
|
|
|
|
This "Quick Start" tutorial is designed to walk you through the basic steps involved in building a multi-level genetic regulatory network model hierarchy in BioTapestry by drawing the top-level model and then creating static submodels derived from that top-level model. While there are other ways to create models (e.g. using lists of interactions entered using dialog boxes, creating dynamic models based on experimental data tables, etc.), the approach used in this tutorial is the most straightforward. The regular BioTapestry tutorial covers the more advanced topics in depth.
The topics being covered here are:
FAQ, Shortcuts, and Getting the Tutorial Model
Drawing the Top-Level Model: Genes and Nodes
Drawing the Top-Level Model: Links
Creating a Hierarchy of Models
Populating the Top-Level Submodel
Populating the Lowest-Level Submodels
Note: This version of the Quick Start Tutorial shows reduced-size screen shots. You can click on any image and see the full-size image in a separate window. To get the version with full-size images, go here.
If you are just starting to learn using BioTapestry, you probably want to skip this section and go straight into the Introduction to start the tutorial.
The help pages available in BioTapestry are the best place to get detailed information about specific issues. But for some basic questions listed below, you can just jump to the appropriate section of the tutorial to get an answer. You can also download the completed Quick Start tutorial model from here, save it on your computer, and load it into BioTapestry if you don't want to start from scratch.
How do I draw links? There are few things about drawing links that can trip up a beginning user. This section of the tutorial teaches the basics of drawing links.
How do I reorganize links after moving nodes around? You frequently need to rearrange links, changing how all the different pieces connect together by "reparenting" selected link segments to other parts of the link tree, or changing where the link ends attach to the nodes. This section introduces this important topic.
How do I create submodels? This section begins the part of the tutorial that talks about how to move beyond drawing a single top-level network model and start creating a model hierarchy. You will want to continue on with the following sections to find out all the steps you need to take.
How do I get colored background squares to appear in my model? Colored squares bound different regions, which are only part of submodels, not the top-level network you draw. If you want to show these regions, you will need to create a model hierarchy with at least one submodel. This section of the tutorial will get you started, and the sections after it will show you how to create regions.
How do I build the network in a submodel? You only draw network elements in the top-level model. For a submodel, you build it up by including network elements from the parent model above it in the model hierarchy. The way you do this depends on whether you are building a top-level submodel, which is explained here, or a lower-level submodel down in the hierarchy, which is explained here.
How do I grey out inactive nodes and links? While it is possible to manually set the actual color of a node or link to be grey, BioTapestry is designed to model this by marking the element as inactive or by not including the element in a submodel. The gray color is then assigned automatically. In particular, the second-level submodels in BioTapestry are designed to make it easy to show only a small active subset within the context of a much larger inactive network. If you want to highlight only certain elements in this way, the best approach is to create second-level submodels. Again, start here, and the specific details of populating this network will be covered when you get to this section. You can also show inactive links and nodes in a top-level submodel, which is explained here
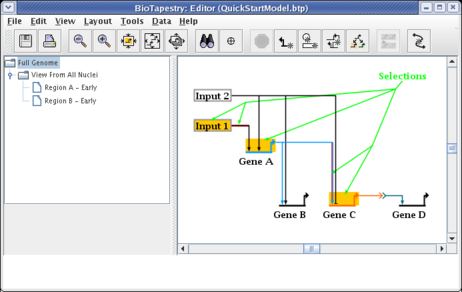
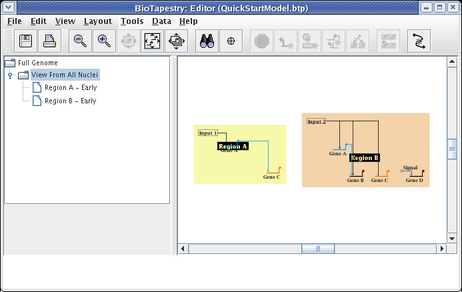
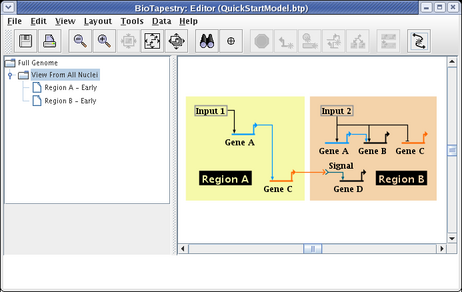
We will be building the model shown below in this tutorial. The model consists of two regions, where there is signaling from Region A to Region B. Note that some network elements are common to both regions, while some are unique. In addition to the network view shown here (the View From All Nuclei), this model hierarchy also consists of a top-level network, as well as two submodels that depict the network state in each of the regions at an early time point. This hierarchy is depicted in the navigation panel on the left:

BioTapestry is a web-based application run using Java Web Start, so it should run on most computers (e.g. Windows, Mac, and Linux). To run it, go to the BioTapestry.org web page and click on the link that says "Click HERE". Java Web Start allows you to create a desktop shortcut to start up BioTapestry without having to visit the web page, and it allows you to run the application without being connected to the Internet. However, the Java Web Start system will insure that your version of the software is kept up-to-date as new versions are released:
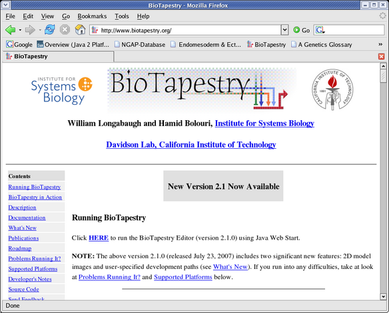
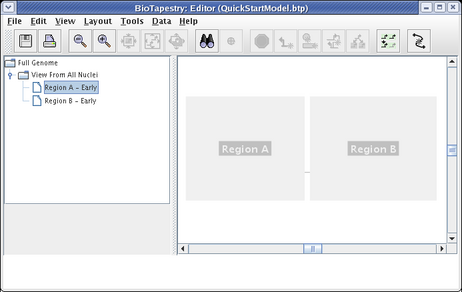
After clicking on the link, if you have not run the program on this computer before, you will need to accept security certificates that insure the software you are running is guaranteed to originate from the Institute for Systems Biology and Sun Microsystems. Then you will see the BioTapestry Editor appear with an empty model:
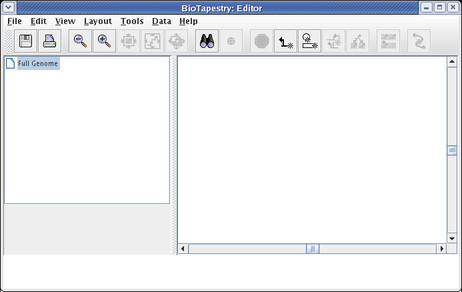
We create a model hierarchy by drawing the top-level model first. This level does not allow you to show separate regions. Instead, you are creating a View From the Genome, where all genes and links appear once in the network. Thus, this view will be the summation of all the network elements that appear somewhere in the lower levels of the model hierarchy. Lower levels of the model are built based upon this top-level version. Separate regions, such as we showed in the View From All Nuclei network at the start of this tutorial, are introduced at the second level in the model hierarchy.
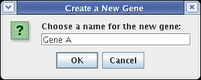
We will begin to draw the model by adding genes first. Start by clicking on the Add Gene... button:
This brings up a dialog. Name the new gene Gene A and click OK:
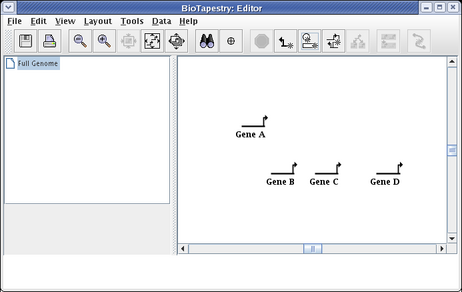
A "floating gene" appears, following your mouse cursor. Locate it where you want to place it and click the mouse. If you want to cancel the placement, just click on the Stop Sign button on the toolbar or press the Esc key on the keyboard. Repeat this gene placement step three more times, placing genes Gene B, Gene C, and Gene D. Your model should now look like this:
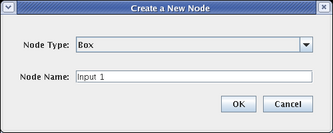
Now we need to add two boxes. Click on the Add Other Node... button:
This brings up the dialog shown below. For Node Type, select Box, and name the node Input 1. Then click OK and place the node. Do this a second time, naming the box Input 2:
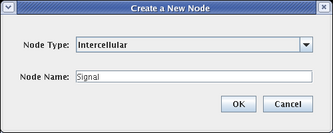
In a similar fashion, place a signal node by selecting a Node Type of Intercellular, and naming the node Signal, as shown below. Then click OK and place the signal node:
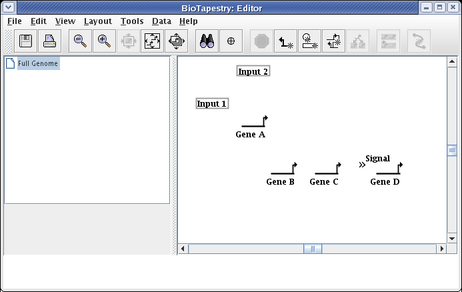
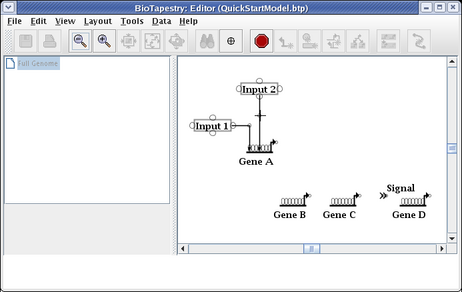
All the nodes have now been added to the model. The layout should look like this. If you need to move nodes around, drag them using the mouse:
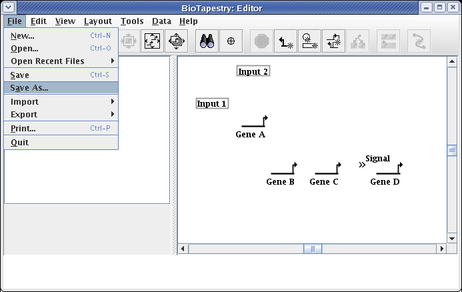
You want to make a habit of saving your work. Choose File->Save As... and save the model (we are calling it QuickStartModel.btp):
We now will draw all the links. It is frequently helpful to zoom in on the area you are working on when drawing links. The various zoom buttons on the toolbar are used for this. From left to right, there are buttons for: zooming out a step, zooming in a step, zooming to show selected items (you need to have selected something to activate this), zooming to bound the current model, and zooming to bound all the models in the hierarchy.
To start drawing links, click on the Add Link... button on the toolbar:
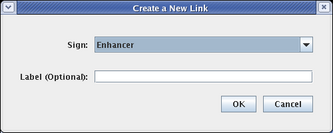
In the dialog that appears, select a Sign of Enhancer. Adding a link label is optional; just leave it blank, and click OK:
When you are placing a link, bubbles appear at the places where you can start and end the link. Just as with placing nodes, you can click on the Stop Sign button or hit the Esc key to cancel the operation. You will draw links by clicking the mouse to: 1) start the link, 2) add corner points, and 3) end the link. If you try to drag the mouse, BioTapestry will ask you to just use clicks. There are some restrictions on where you can start and end links. For example, you can't end a link on the same pad that a link is starting from, and on some nodes (like genes) you can only start links from certain pads and end links on other pads. If you pick an incorrect pad, BioTapestry will display an error cursor.
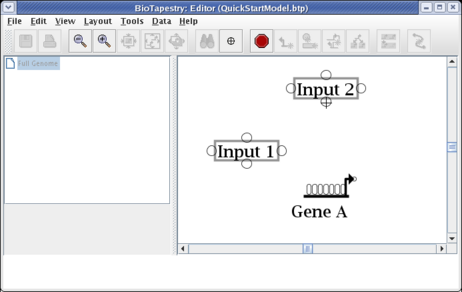
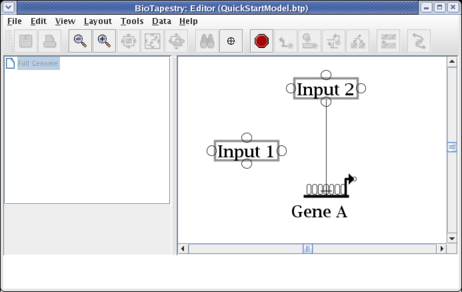
We will first draw a link from the bottom of Input 2 directly down to Gene A. (Note: you may want to zoom in now to view just the area detailed below.) Start by placing the crosshair cursor over the start bubble, and click the mouse:
After starting the link, a thin black line follows the cursor around to show the link path:
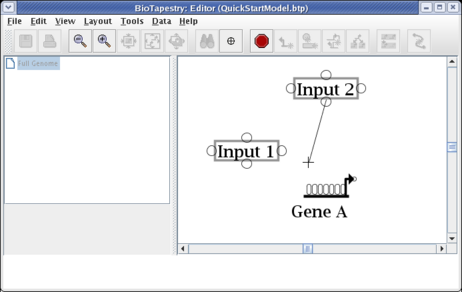
Move the cursor over the target bubble:
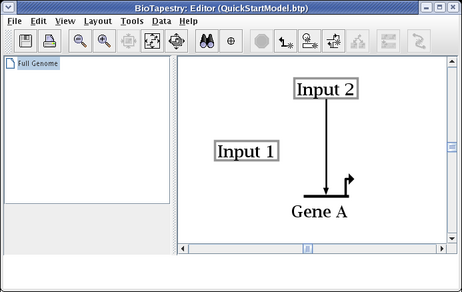
And click to finish the link. The placement is complete, and the link is now drawn in:
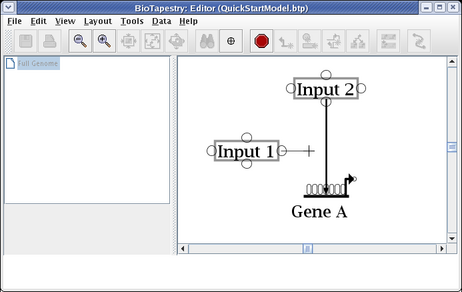
Create a second link, this time from the right side of Input 1 to Gene A. Start as before, but this time click the mouse as the link is being drawn to create a corner point:
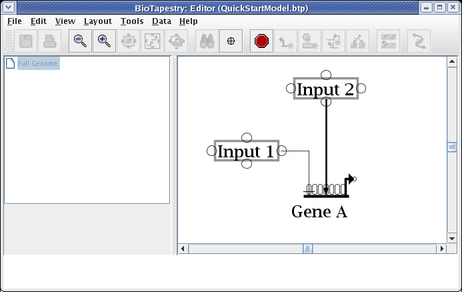
To finish the link, place the crosshair cursor over the target pad as shown and click to finish the link:
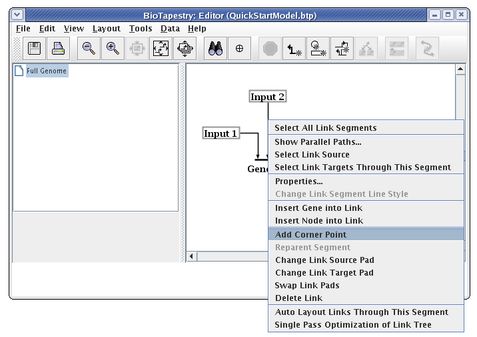
The essential thing to know about drawing the "circuit-trace" style of links in BioTapestry is that each node has at most one outbound "tree" of links. Once a link has been drawn from a node, all other links from that node must be started from somewhere on the existing link. Links originate from corner points, so if you don't have any bends in your existing link, you will need to add corner points. We are now going to draw the link from Input 2 to Gene B. To do this, right-click (Note to Mac users: if you're using a one-button mouse, press the Control key while clicking the mouse to do this) on the existing link from Input 2, and select Add Corner Point from the menu:
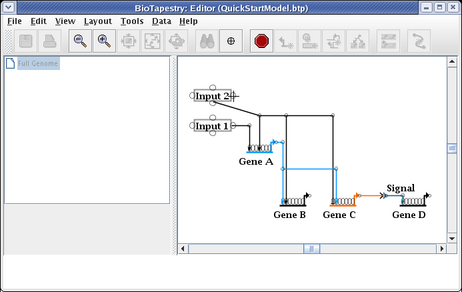
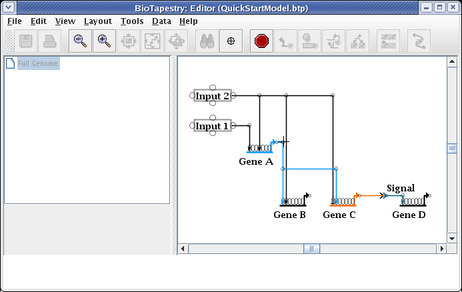
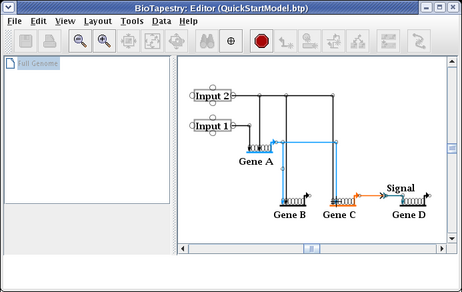
During many link drawing and editing operations, the corner points are toggled on during the operation. To see the corner points at other times, you can toggle the Toggle Link Pads button on the toolbar:
The places where you can draw links from and to are shown as bubbles. Now draw a link from the new corner point to a landing pad on Gene B, by first clicking on the new corner point:
Add a corner point to create a bend, and then finish the link by clicking on a target pad on Gene B:
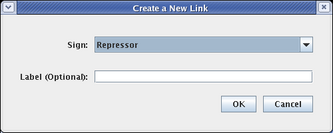
The next link will be from Input 2 to Gene C. Proceed as before, but since this will be a repressive link, select a Sign of Repressor on the link creation dialog:
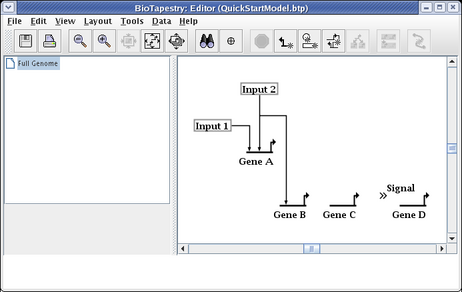
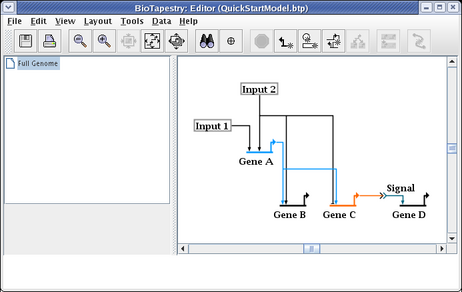
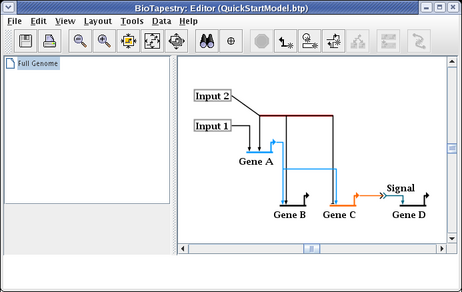
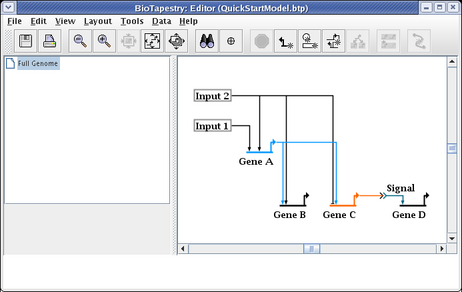
Continue adding all the rest of the links until the model appears as below. Colors are assigned automatically to genes and some other node types as soon as you draw a link from them, so the colors of your model may be different depending on the order in which you draw your links.
Note that the link from Gene C to the Signal node is best represented by assigning it a Sign of Neutral, which draws the link without any arrowhead:
It is common to have to edit the link layout after dragging nodes around. For example, drag Input 2 until it is above the Input 1 node. The resulting link layout needs to be made orthogonal again:

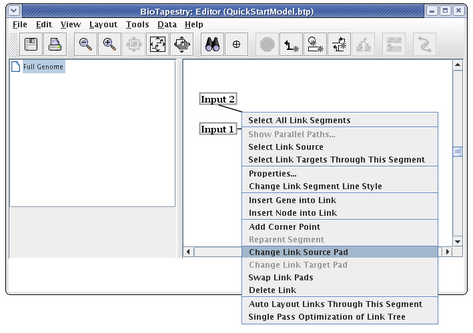
You do not, as a rule, want to delete links and redraw them, since when you have submodels, this would require you to go and repopulate the submodels with the deleted links. Instead, edit the links. A very common operation is to change where a link leaves and lands on a node. In this case, we now want the link to start on the right side of Input 2. Right-click on the link and select Change Link Source Pad:
The cursor changes to a crosshair. You just click on the new source pad:
And the link now starts from the newly selected pad:
To get the links back to being orthogonal, we will drag the two horizontal segments up to be even with the source pad. Click on one of the segments, then hold down the Shift key while clicking on the other segment. This will leave you with the two link segments selected:
Then drag one of the segments up to where you want it; the other selected segments will follow. When this is done, just clicking on the unoccupied background will unselect the segments.
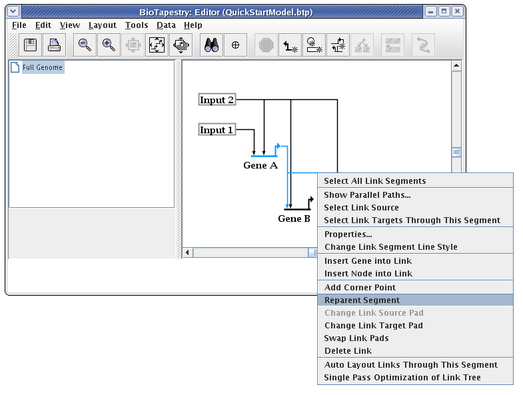
In addition to moving link segments around and changing the start and end points, you frequently want to reorganize where a segment is attached to the rest of the link tree. You almost never want to reorganize a link tree by overlaying a link segment on top of another to make it appear as a single link. Instead, you right-click on a segment and select Reparent Segment:
The cursor changes to a crosshair, and you just need to click on the corner point where you want the segment to be reattached in the link tree. In this case, we want to move the link from Gene A to Gene C so that it is even with the launch pad. (Of course, you could do the same thing by just deleting the corner point next to Gene A and dragging the segment up, but this is to give you practice reparenting links):
After the reparenting operation, you will want to move the cursor over the corner point above Gene C so you can drag just that corner up:
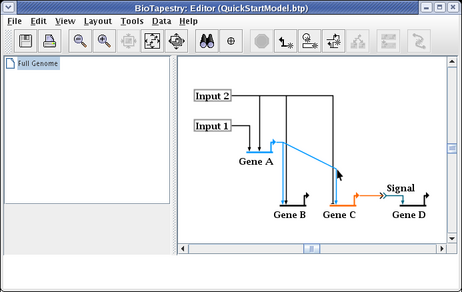
Drag the corner point up so the link is again orthogonal, and you are done:
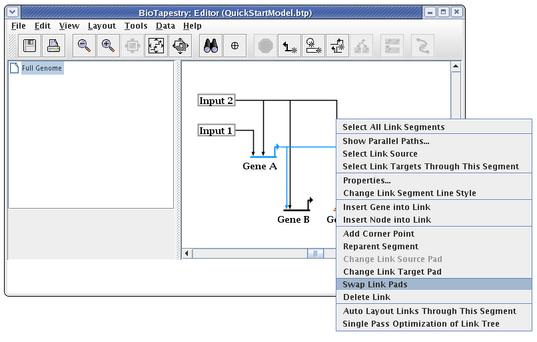
When drawing and laying out links, unless the ordering of the links inbound to a gene is important (as it would be if you were trying to match the ordering of cis-regulatory regions), you usually want to arrange things so that link crossings are minimized. For example, with Gene C, the layout will be cleaner and easier to follow if the two inbound links are swapped. To do this, right-click on one of the links (here we choose the link from Input 2), and select Swap Link Pads from the menu:
With the crosshair cursor, now click on the landing pad where you want the link to go (in this case, the pad where the link from Gene A lands:
This causes the two links to swap landing locations. Now drag the corner points to make things orthogonal. It is frequently best to first drag the corner point closest to the target (in this case, do the link from Gene A first):
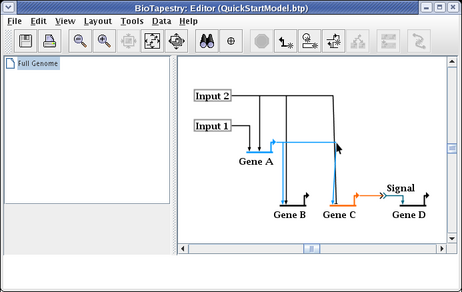
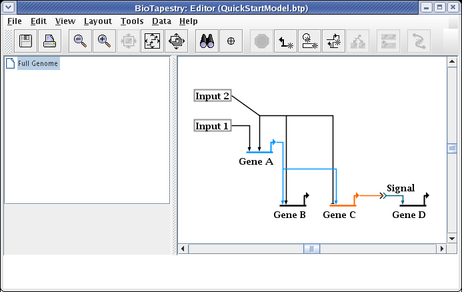
This gives us the final link layout for the model:

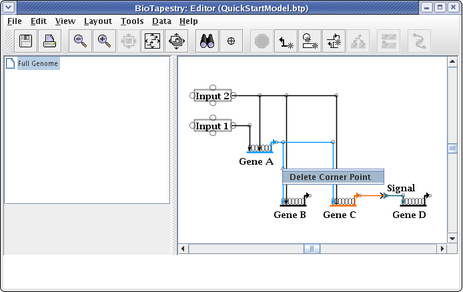
While unused corner points are generally innocuous, cleaning them up may make link drags go more smoothly and eliminate surprises when right-clicking on a straight link run. To delete a corner point, just right-click on it and select Delete Corner Point. It will be easier to toggle the bubbles on first so you can find the corner point:
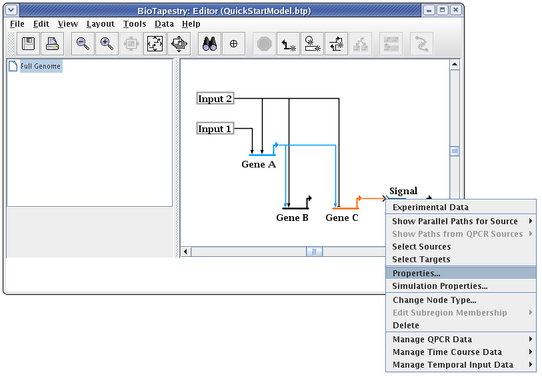
The last step to complete the top-level model is to clean up the presentation of the Signal node. To do this, right-click on the node and select Properties...:
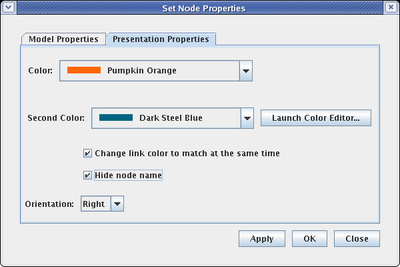
Select the Presentation Properties tab on the dialog. We want to hide the Signal node name, so check the Hide node name box. Also, we want to change the Color of the node to match the inbound link. Here it is set to Pumpkin Orange, but the color you select may be different, depending on the order you used to draw links:
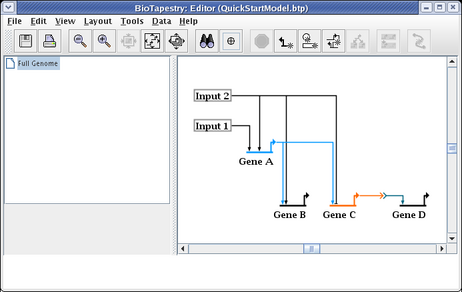
This completes the creation of the top-level network model. If you haven't been doing it, now is a good time to save your work!
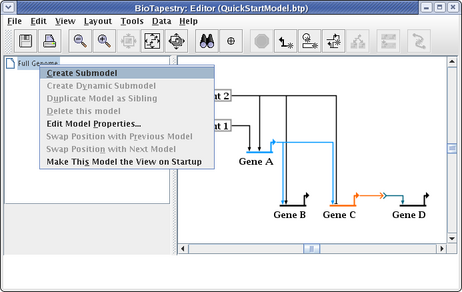
We will now create a hierarchy of models based on this top level model. To create the first submodel, right-click on the Full Genome element in the navigation tree on the left, and select the Create Submodel item:
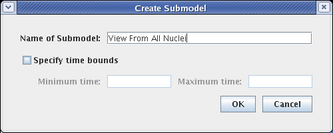
This brings up the Create Submodel dialog. Give the model the name View From All Nuclei:
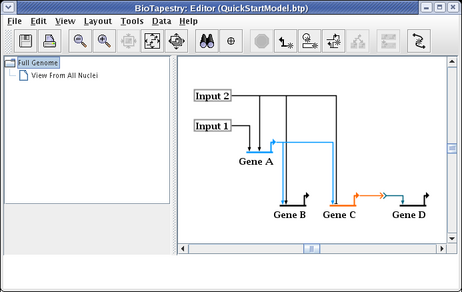
This creates a submodel that is parented by the Full Genome model, as shown below. The model view does not switch; if you select the new View From All Nuclei model to look at, it is completely empty at this point.
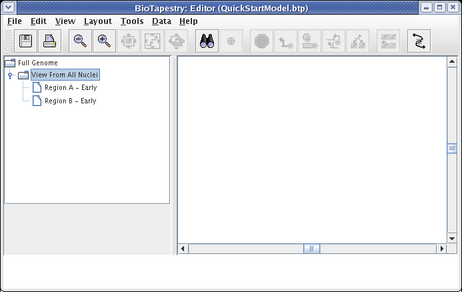
At this point, we also want to create two submodels of the View From All Nuclei model. Repeat the above steps twice, but this time right-click on the View From All Nuclei model instead. Call the first model Region A - Early and the second model Region B - Early. Your model hierarchy will now look like this:
Having created the model hierarchy, we will now populate the View From All Nuclei model. Click on the top-level Full Genome model in the navigation view. Click on the node Input 1 to select it. Then, holding down the Shift key, continue to select Gene A, Gene C, the first segment of the link out of Input 1, and the last segment of the link going from Gene A into Gene C. Following your selections, your network should look like this:
Now click on the Propagate to Submodel toolbar button:
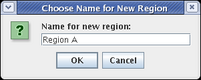
Whenever you are propagating network elements down into a submodel, they need to be assigned to a specific destination region in the submodel. Network elements cannot appear in the submodel unless they belong to a region. (Or, in the case of links, the link must have an assigned source region and destination region; these are frequently the same.) In this case, since no regions yet exist in the target submodel, you need to specify the name of the new target region. Set the Name for new region to Region A and click OK:
(If you select the View From All Nuclei model, you will see the elements added to the model; select the Full Genome model again to continue building.)
It is worthwhile to note that this propagation step can be tricky, so there are some pointers to keep in mind. First, the segments that you select for a link are important. In the next propagation step described below, note that we are going to be specifically selecting the first segment of the link out of Input 2. This is a shorthand for selecting all the links out of Input 2. In the cases where you select the last segment of a link just before it hits a target, only that one link to that target is being specified. Segments between these two extremes are shortcuts for all the links passing through that one segment. So choose your link segment selections with care.
Also, you may run into problems if you select links, but do not also select the source and target nodes (unless they have already been propagated in a previous step.) Furthermore, if you select a set of nodes and links that cannot be propagated unmbiguously into a single target region, the step may fail. If you run into any unexpected problems while propagating, immediately use the undo function (Edit->Undo ...) before continuing.
So if you find it tricky to propagate selectively, one way to approach this is to select the entire model (using Edit->Select All) and propagate everything down into each target region in your submodel. Then, go to the submodel and delete the elements you do not need from each region in the submodel. Then, if you have any links that go between regions, go back and propagate them down one at a time.
In this example we will continue to propagate selectively, adding elements to Region B of the submodel. Like before, select the network elements by clicking on the first one and then Shift clicking on the rest. As shown below, you want to select Input 2, Gene A, Gene B, Gene C, Gene D, the Signal node, the first segment of the link out of Input 2, the last segment of the link out of Gene A into Gene B, and the first segment of the link going from the Signal node into Gene D. Double-check that your selections match the picture below, then click the Propagate to Submodel toolbar button. If you miss any items, you can always go back and propagate them later:
In this case since Gene A and Gene C already exist in Region A, and since nodes cannot be duplicated in the same region, the program doesn't bother to ask you if you are propagating into Region A or into a new region; it immediately asks for the name of the new region. If the target region is ambiguous, you are given the chance to select an existing region or to create a new one.
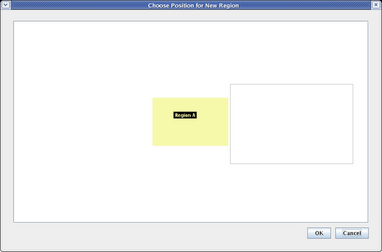
When you are asked to name the target region, name it Region B and click OK. You are then shown a dialog that allows you to place the new region among the existing regions. Click to place the new region to the right of Region A, and click OK:
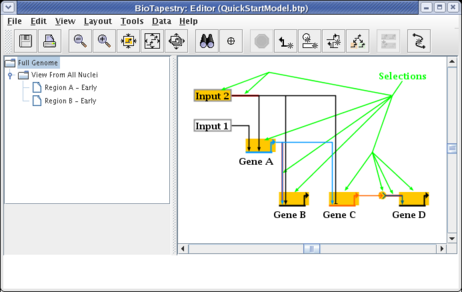
Now select the View from All Nuclei model, and you will see the initial placement of the new elements. Since the layout of each submodel at this level of the hierarchy can be completely different from the top-level layout, the auto placement of network elements when the two layouts are different can be messy. Usually you will have to do some clean-up placement:
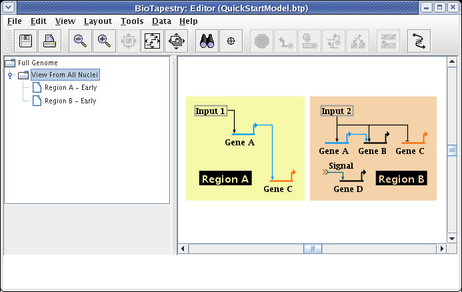
The region color blocks automatically bound all the nodes in the region. To get the desired layout, drag the nodes around, clean up the links, change the start pad of the link out of Input 2, and drag the Region A and Region B name tags around. Note that changes to layout made at this level are not reflected in the top-level model; the two layouts are independent. Make your layout changes until your model matches the following:
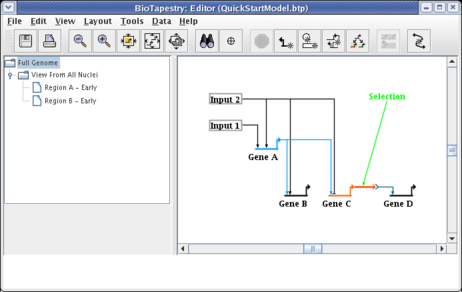
Note that we still have one more link to add to the submodel: the signal link going from Gene C in Region A to the Signal node in Region B. So select the Full Genome model and click on that link to select it:
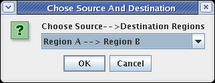
When you click on the Propagate to Submodel toolbar button, you should be presented with the dialog box shown below. This pops up because the source gene, Gene C, exists in both Region A and Region B, so it is not clear which link you want to add. If there was no possible ambiguity, the program would not ask before propagating the link down. Select the choice Region A -->Region B and click OK:
Your model should now look like the following:
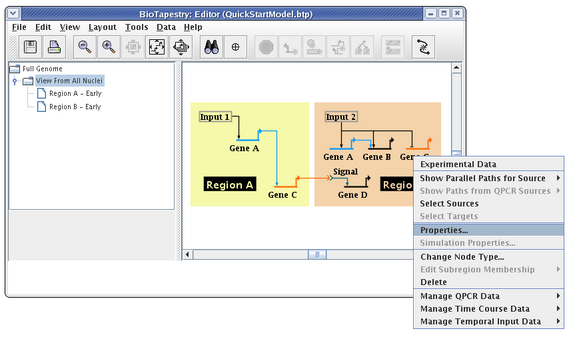
In many model hierarchies, this level is used to show all the genes and links that are active during some time span, so nodes are links are typically fully colored in at this level. However, because Input 2 is repressing Gene C in Region B for the entire time under study, we prefer to show that instance of Gene C as always inactive. While you could do this by changing the gene color to grey, the preferred approach is to specify the gene activity level as inactive; this is a property of the model, not of the specific layout of the model. Again, access the properties dialog by right-clicking on Gene C and selecting Properties... from the menu:
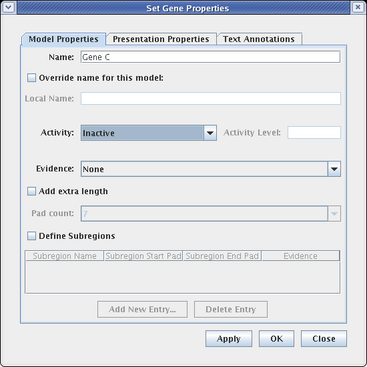
On the Model Properties tab, set Activity to Inactive, and click OK:
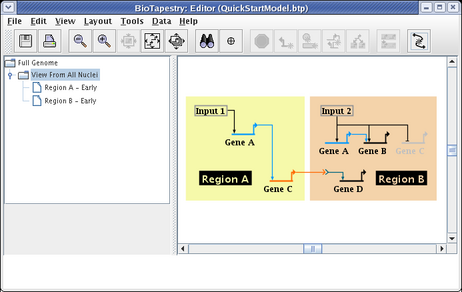
As shown here, inactive genes are drawn grey. If desired, links can also be set as inactive at this level, via the Link Properties dialog.
One last thing to tweak in this layout, if desired, is to hide the label of the Signal node. That layout property is not shared with the layout of the top-level model, so it would need to be applied again at this level.
We are now ready to populate the two submodels of the completed VfA:
We will first populate the Region A - Early model. Select that model in the navigation tree. As shown here, the parent model is shown ghosted in this model. Since all models at or below this level of the hierarchy are subsets of the parent model, the layout is now shared with the parent model. All that is required to populate a model at this level is to click on the ghosted elements you want to include; any element you do not include remains ghosted:
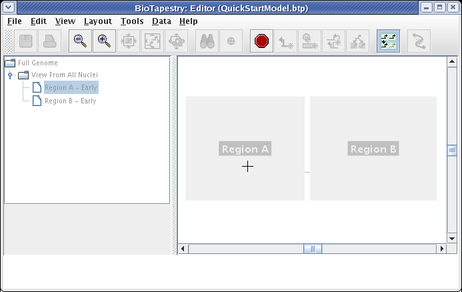
To begin populating this model, click on the Choose Subset of Parent toolbar button:
You will now remain in this selection mode until you hit the Esc key, or click on the Stop Sign or Choose Subset of Parent toolbar buttons. To begin, place the crosshair cursor over the ghosted Region A and click:
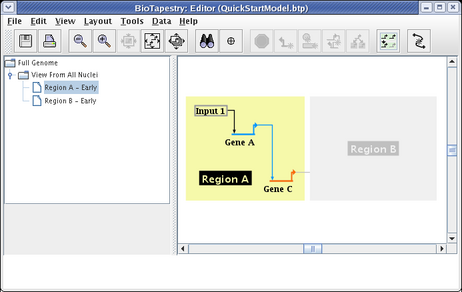
Region A will then appear colored. Then click on all the nodes, Input 1, Gene A, and Gene C, as well as the links between them. This produces the following model:
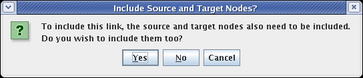
It is not possible to include just the link between two nodes without also including the nodes themselves. In fact, if you click on the link before including the endpoints, you are presented with the following dialog, requiring you to make the choice:
The typical usage of these submodels is to show just the fraction of links and nodes that are active in some set of conditions, while showing the inactive parts as ghosted. Whatever is not included from the parent appears in this ghosted state automatically. However, you may want to show a target gene as not expressing, even though the link into it is active. As we just saw, you cannot include just the link without also including the target. In these cases, you need to include the target, and then set its activity level to inactive, as was shown above for the parent model. So after including Gene C and setting it to Inactive, we have the final version of this model, showing the early state of Region A:

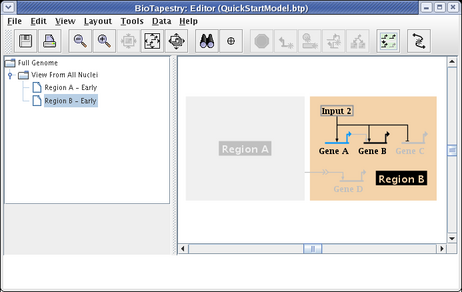
The Region B - Early model is built in the same fashion. After choosing the model and clicking on the Choose Subset of Parent toolbar button, click on Region B, then click on the link out of Input 2, and answer Yes when asked if you want to include targets. The model will then appear as below. Note how Gene C is already tagged as Inactive, since it is inactive in the parent model, so it appears grey even though it has been included:
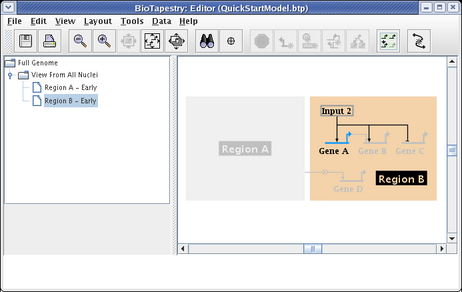
Finally, since Gene B is not yet expressing at this early stage, set it as Inactive using the Gene Properties dialog, as we have shown above. That will give us the finished model:
This QuickStart Tutorial was designed to walk you through the basic steps involved in building a multi-level genetic regulatory network model hierarchy in BioTapestry by drawing the top-level model and then creating static submodels derived from that top-level model. To take a tutorial that goes into more detail on creating dynamic data-driven models, building models using interactions lists and spreadsheet inputs, and other advanced topics, refer to the more in-depth regular BioTapestry Tutorial. If there are any other questions about using the program that are not covered by these tutorials, the online help and the PDF User Guide are another resource to explore.