|
|
|
|
|
|
|
|
Note: This version of FAQ Answers: Visual Appearance of the Network shows reduced-size screen shots. You can click on any image and see the full-size image in a separate window. To get the version with full-size images, go here.
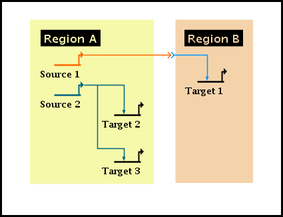
While it is possible to manually set the actual color of a node or link to be grey (by explictly setting the presentation color to grey), BioTapestry is designed to handle the display of inactive network elements either by marking that element as inactive or by not including it in a subset submodel. The grey color is then assigned automatically.
In particular, the subset submodels in BioTapestry are designed to make it easy to show only a small active subset within the context of a much larger inactive network. So if you want to show a network in this manner, the best approach is to create subset submodels. The online Quick Start Tutorial will get you started with creating these submodels, and this section talks about including the active elements in the submodels.
As for the levels above the subset submodels, the top-level root network currently has no way of setting node or links to inactive. At the next level of the hierarchy, the top-level instance models, you can show inactive links and nodes by setting the activity level to that value, which is explained in the online tutorial in this section.
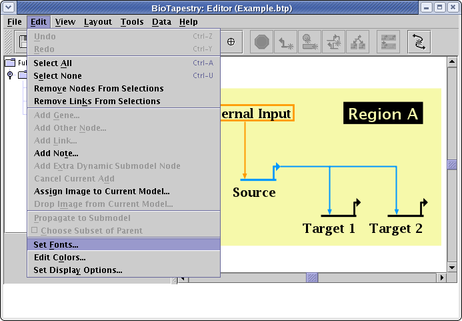
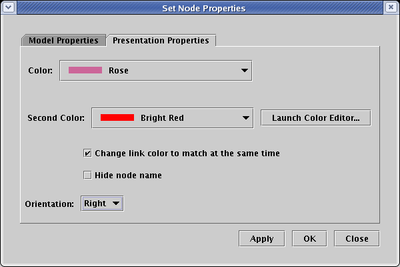
You can change the colors of a link, node, or region by right-clicking on it, choosing the Properties... item in the pop-up menu, and selecting the Presentation Properties tab in the Properties dialog:
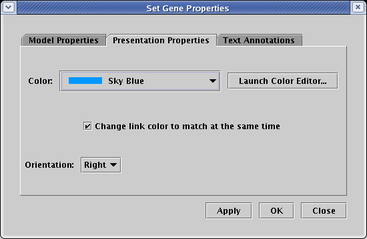
The colors you can choose from are in a predefined palette of colors. If you wish to change those predefined colors, or add your own new colors to the palette, you can do so by either clicking on the Launch Color Editor... button on the Presentation Properties tab (see above), or by selecting Edit->Edit Colors... from the main menu:
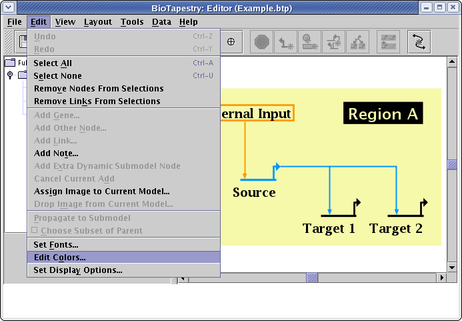
Which brings up the Manage Colors dialog where the colors can be edited:
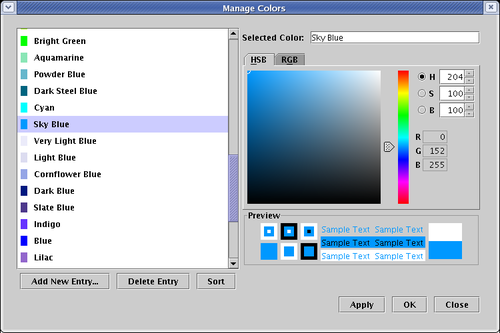
Because the colors assigned to network elements reference an underlying palette of colors, it is the case that if you edit an underlying color definition, every element that is assigned to that color will change accordingly. Also, if you change a source node or link color, you can request that the associated link or source node be changed at the same time.
However, if you are wanting to select a group of heterogeneously colored network elements and request that they all be set to the same color, that capability is unfortunately not yet in BioTapestry. That feature is on the list of requested enhancements.
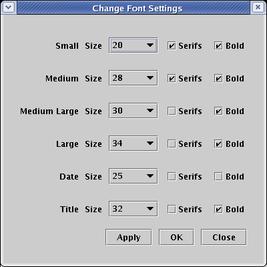
There is a limited ability to specify the fonts used by BioTapestry. You can set the sizes and some properties for classes of fonts, but you cannot currently override these settings for individual nodes, genes, links, or regions (this is on the list of requested enhancements). Select Edit->Set Fonts... from the main menu:
This brings up the dialog shown below, where you can set the size, boldness, and presence of serifs for the different classes of fonts. These six classes are used as follows:
Small: This is the font for superscripts, which can be specified using a carat, e.g. N^IC gives NIC
Medium: This is used for labels of nodes, genes, links, and gene regulatory regions.
Medium Large: This is used for labels of subregions.
Large: This is used for labels of regions and notes.
Date: This is used for the date, attribution, and key text (model description data).
Title: This is used for the model title (i.e. the model's Long Name).
Version 2 of BioTapestry provides much more flexibility for specifying the style of link drawing. The link color, thickness, and style (solid, dashed, or dotted) can be specified for:
![]() A full tree of links
A full tree of links
![]() Individual links in a tree
Individual links in a tree
![]() Individual link segments
Individual link segments
To set the drawing properties for a link, right-click on a segment of the link, select Properties... in the pop-up menu, and then select the Presentation Properties tab in the dialog. If you want to set properties that apply to the entire tree of links, you use the options here. In addition to color, you can set the Line Style to Solid, Dashed, or Dotted, and the Line Thickness to Regular, Thin, Thick, or Specify. For specify, you enter a positive integer for Thickness value:
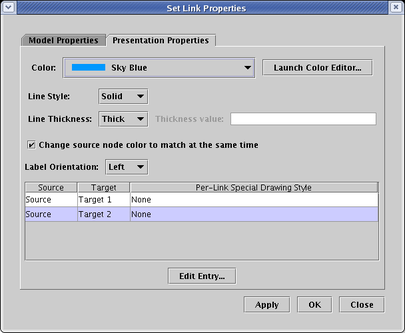
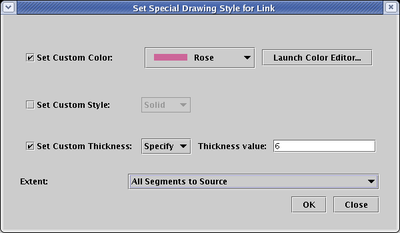
If you want to specify a special style for a particular link, you select the link entry in the above dialog and then click Edit Entry.... You then get a dialog (shown below) that allows you to make the same settings for the particular link. The advantage of this approach (in contrast to making explicit changes to particular individual link segments) is that these properties will follow the link around no matter how you relayout the link tree.
An additional option to specify when setting the style for a link is the Extent. This tells the program how far back towards the link source the special properties should be extended. This is important, since link segments are shared by many different links in the tree, and it is possible to specify extents that cause inconsistent properties. In those cases where inconsistent properties overlap, the software goes through a series of tie-breaker tests to determine the final rendering of the link.
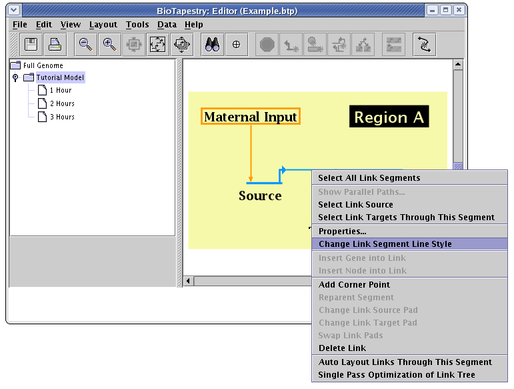
The final way to set link properties if by explicitly setting them for individual link segments. This was the approach used in BioTapestry Version 1, but it is almost always better to use the per-link approach. With this approach, these properties may be discarded if the link tree is laid out again. To use this approach, you right-click on the desired link segment and choose Change Link Segment Line Style (see below). You will get a dialog box much like the one for the per-link settings shown above.
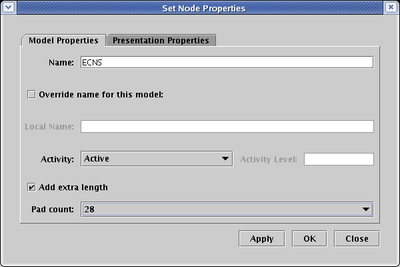
Starting with BioTapestry Version 2, every node type but slashes can have extra link pads added, allowing you to grow the nodes as needed to provide every incoming link with its own landing pad. To change the pad count, right-click on a node, choose Properties... from the pop-up menu, and on the Model Properties tab, check the Add extra length box and then select the Pad count you want:
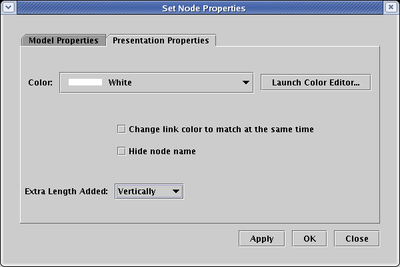
Most node types only grow in a certain direction when you add extra pads (e.g. text nodes always grow horizonally), but bubble and diamond nodes can be grown either horizontally or vertically. So, for example, with the previous example of setting a bubble node to have a Pad count of 28, you can then select the Presentation Properties tab, set the Extra Length Added option to Vertically, and click OK:
This would result in the bubble being stretched vertically to accomodate the extra pads:
When you place a node, it is drawn in a default orientation. Some directional nodes can be rotated or flipped so they point in a different direction, as listed in this table:
| Node | Direction Options |
|---|---|
| Gene | Right, Left |
| Plain Text | None |
| Box | None |
| Bubble | None* |
| Intercellular | Right, Left, Up, Down |
| Slash | Right, Left, Up, Down |
| Diamond | None* |
To change the orientation of a node, right-click on the node, select Properties... from the pop-up menu, select the Presentation Properties tab, set the Orientation to the desired direction, and click OK:
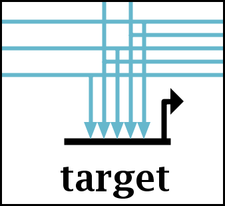
If you are having trouble distinguishing the signs of the links, you can increase the size of the repression link "feet"; the arrowhead size is currently fixed. The larger foot size is global, and cannot be modified on a per-link basis. Note that if you increase the size of the repression feet, you will have to manually make sure the spacing between incoming links into a target is large enough to keep the link ends from overlapping.
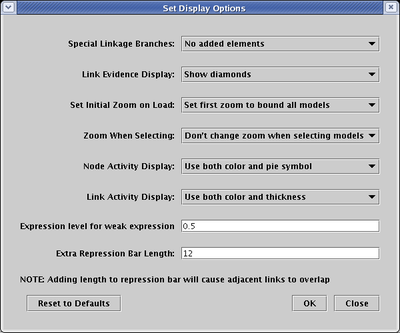
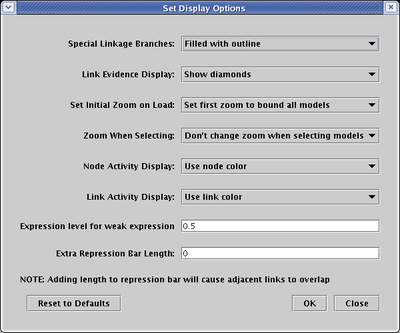
To increase the size of the feet, select Edit->Set Display Options..., type a positive integer into the Extra Repression Bar Length field, and click OK:
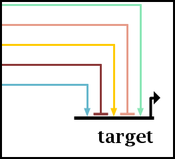
Which makes the feet larger. Note how the links were drawn to land on every other target pad to accomodate the larger foot size:
Although BioTapestry makes as effort to assign link colors so that crossing links will not share the same color, and there is a layout tool described here to help you do it, there is a limit to this color-only approach. When links with the same color cross each other, it can be hard to keep things straight:
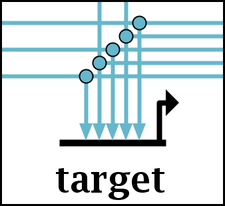
One way to help eliminate confusion is to attach a symbol to actual link branches of three or more segments. Select Edit->Set Display Options... from the main menu, and set Special Link Branches to either Filled or Filled with Outline:
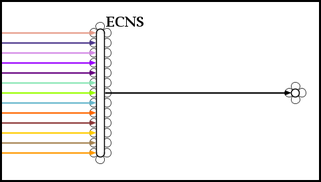
With this option set, small circle symbols (easily distinguished from bubble nodes due to size) are drawn at link branches. Even if you can assign colors to eliminate ambiguity, this feature can be extremely valuable with large-scale networks, as the bubbles make it easier to rapidly scan a link trace and quickly spot where links branch off to targets:
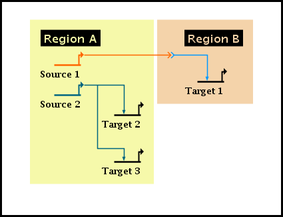
Regions are automatically sized to enclose the region label and all the nodes in the region, including intercelluar signal nodes, which still must belong to either the source or target region. The region sizing calculation makes no attempt to enclose links, nor does it try to match juxtaposed regions. And in the case of the intercellualar nodes, it is often desirable to make the node appear to be outside the region bounds:
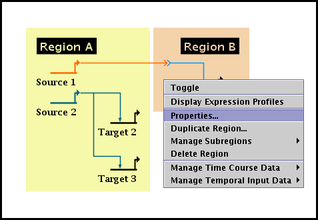
You can tweak the region bounding process by specifying the padding that is applied to the basic bounds calculation. These pads are part of the region's properties. Right-click your mouse on some unoccupied portion of the colored region, and select Properties... from the pop-up menu:
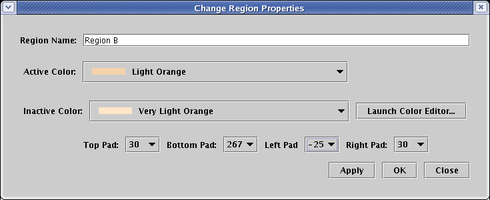
Then change the four pad values to achive the desired effects. To get the intercellular signal node to appear outside the region, select a negative value for Left Pad (here we choose -25). To match up the bottom edges, we set Bottom Pad to 267. The Apply button is very useful here; you can keep tweaking the value until you get the desired effect without having to close the dialog, then click Close when you are done:
The resulting layout is much closer to what we want. However, be aware that the exact size of a region depends on the text size of the node labels, and these can vary slightly with magnification and between fonts supplied on different computers. So it is very hard to get exact single-pixel region sizing that is always perfect.