
|

|

|

|

|

|
Note: This version of FAQ Answers: The Model Hierarchy and Submodels shows reduced-size screen shots. You can click on any image and see the full-size image in a separate window. To get the version with full-size images, go here.
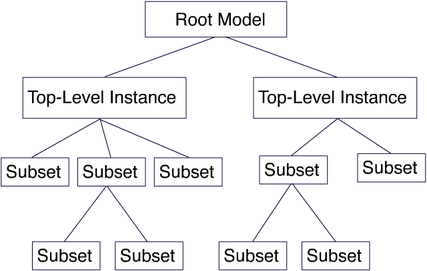
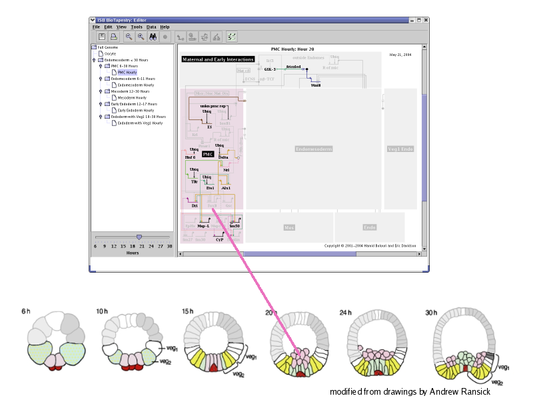
BioTapestry organizes a network model into a layered, multi-level hierarchy consisting of a single root model at the top, zero or more top-level instance models in the next layer, and then zero or more additional layers consisting of any number of subset models (see the figure below).
The hierarchy framework is very flexible, and although the following example describes how the sea urchin endomesoderm model uses the framework, it can be used in a variety of different ways.
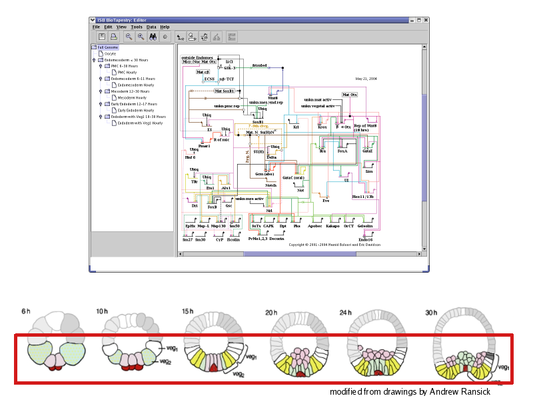
The Top-Level Root Model: At the top of the hierarchy sits the root model; all submodels are derived from this model. The root model contains a single copy of each gene, node or link that appears in any of the submodels. Thus, this level depicts all of the interactions between the network elements regardless of when and where those interactions occur:
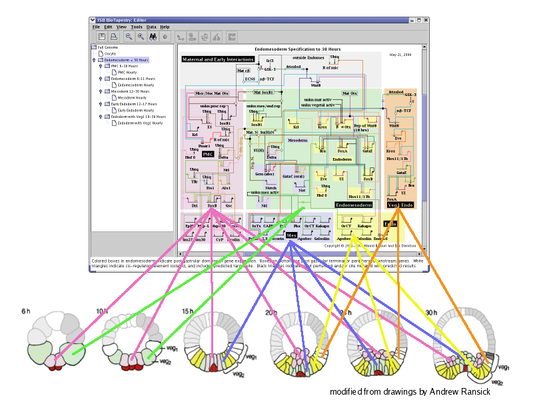
Top-Level Instance Models: The next level in the hierarchy is where different regions are introduced. Each region can have a separate copy of any gene or node present in the root model, and there can be a unique instance of each link for each (source, destination) tuple of regions. In the endomesoderm model example, this level is showing the interactions present in all the different regions from 6 to 30 hours. Focusing on individual regions and shorter time periods is the role of submodels further down in the hierarchy:
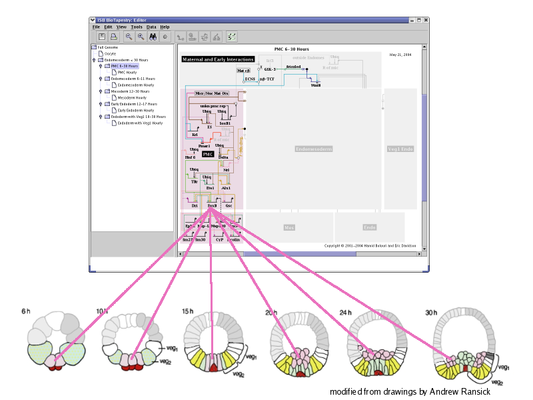
Subset Models: This level of the hierarchy shows a subset of the regions and interactions present in the parent model. In this example, this submodel includes the PMC region over the full time span from 6 to 30 hours. For this model, BioTapestry is automatically using the underlying temporal/spatial expression data and temporal input data tables to display those elements in the PMC region that are active sometime during the 6 to 30 hour period:
The lowest level of the hierarchy is again a subset of the model above it. This example shows hourly views of the PMC region. As with the parent model, these hourly views are automatically generated from underlying expression and input data tables. Each hourly view is selected using the time slider in the lower left of the BioTapestry window. This feature allows the user to quickly visualize how the network interactions evolve over time:
There are two types of subset models: static and dynamic. Static models are constructed by:
1) Choosing the regions in the parent model that you wish to include in the subset.
2) Clicking on the nodes and links that you want to include in the subset.
Dynamic models use the time expression data tables and temporal input data tables to automatically populate the nodes and links in the subset model. The only action the user needs to take (other than populating the underlying data tables, and possibly specifying how network elements and regions correspond to those table entries) is to choose the regions from the parent model to include in the subset.
There are two types of dynamic subset models: summation models and hourly.
Summations: With a summation subset, you specify the time range that the model spans, and then BioTapestry produces a single view that shows all of the active nodes and links present in the subset within the time period. A summation subset can still serve as a parent model to further subset models that are either summations or hourly.
Hourly: The other type of dynamic subset is hourly. As with the summation subset, you specify the times you want to display (where that range of hours is a subset of the time points in the parent model). BioTapestry then makes a set of views, one per time point, that cover this time range. Hourly subset models cannot themselves be parent models; they are required to be at the bottom of the model hierarchy.
Yes, you can just draw a root model; the online BioTapestry Quick Start Tutorial teaches you how to draw a network starting at the level below the root model (a top-level instance model), but these node and link drawing operations are applicable for root models too.
But if you want to introduce regions and/or have pieces of the network duplicated, you will need construct at least a two-level model hierarchy. And if you want to show how the network evolves over time, that is easiest if you build subset submodels. These topics are also covered in the Quick Start Tutorial.
This section of the online Quick Start Tutorial begins the discussion about how to create a model hierarchy.
Colored squares bound different regions, which are only part of submodels, not the top-level root network. To get regions, you need to be working in the second layer of the model hierarchy. The online Quick Start Tutorial can get you started on building submodels.
Starting with Version 3, you have lots of flexibility in how you build your model hierarchy. In older versions, you could only draw nodes and links to create the top-level root model, and then you would build submodels by selecting network elements from the parent model above it in the model hierarchy. The online Quick Start Tutorial tells you how you can now draw a network directly in a submodel. The old techniques for starting at the top and working down still work too, if you prefer them.
The sea urchin endomesoderm model uses dynamic submodels, which allow you to use an interactive time slider to visualize changes. These dynamic submodels require you to set up tables with expression and input data. It is usually much simpler to build static submodels, where you just click on elements you want to show as active. The online Quick Start Tutorial describes step-by-step how to build such a static submodel hierarchy. When used in conjunction with paths, which are covered in this tutorial, static submodels can provide much of the interactivity of the dynamic submodels
To get an interactive time slider that you can use to visualize changes, you need to build a dynamic submodel, which decides which elements to show as active by pulling values out of tables of expression and input data. Furthermore, there are two different types of dynamic submodels: summation and (assuming your time units are hours) hourly. Only the second uses a time slider control. Learning how to build dynamic models is covered in the online Dynamic Models Tutorial.
A summation dynamic submodel does not have a time slider, but creates a single display that integrates all the data over the specified time span and show a summary view of all active genes and interactions. To get the slider, right-click on the model entry in the navigation tree, select Edit Model Properties..., and in the dialog box (assuming that your time units are hours), change the Type choice to Every Hours (sic). Consult the online Dynamic Models Tutorial for more information.
When building a dynamic submodel, even after stocking the data tables and creating the model, you need to tell the program what regions you wish to include in the model; otherwise they will appear greyed out. A region is included by first clicking on the Choose Subset of Parent button in the toolbar, then clicking on the desired region with the crosshair cursor. When you are done, exit the choose mode by pressing the Esc key, the Stop Sign, or clicking again on the Choose Subset of Parent button.
Since there are many constraints required to maintain consistency between the models in the model hierarchy, copying features in BioTapestry are currently somewhat limited. It is also true that you cannot copy elements between two different instances of BioTapestry running on your desktop. However, there are two significant copy features that help you to construct large networks:
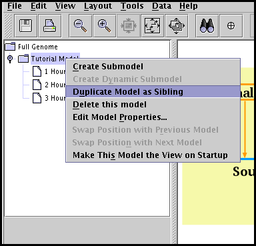
Duplicate model as sibling: A submodel, and optionally all its child models, can be duplicated as a new sibling submodel in the model hierarchy. (i.e. the copy will still have the same model as a parent). So if you have created a complex hierarchy, you can copy it as a sibling and then tweak it to show the changes occurring over time. To access this feature, right-click on a submodel in the left-hand navigation panel, and choose Duplicate Model as Sibling:
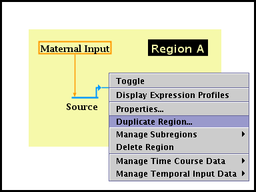
Duplicate region: All the nodes and links in a region of a submodel can be duplicated into a new region of the submodel. In a submodel, right-click on a an unoccupied part of the region rectangle, and select Duplicate Region:
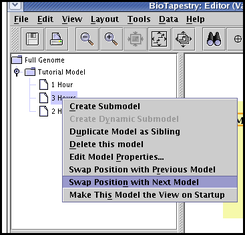
Since the contents of a submodel is constrained by its parent model, you cannot move models up or down in the hierarchy. But if two models have the same parent model, you can swap the position of a submodel with the model next to it. Since new models are always added at the bottom of the set of sibling models, successive swaps can move the new model up in the set to where you want it. To swap model positions, right-click on a model name in the left-hand navigation view and select either Swap Position with Previous Model or Swap Position with Next Model:
Almost; once you have created or pulled down a region in a submodel, you can right-click on the region and select Import Entire Network into Region. This will immediately stock the region with all contents. Links between regions still need to be brought in one at a time.