|
|
|
|
|
|
|
|
Note: This version of FAQ Answers: Experimental Data Entry and Presentation shows reduced-size screen shots. You can click on any image and see the full-size image in a separate window. To get the version with full-size images, go here.
Although the raw perturbation data tables in BioTapestry are tagged as being "QPCR" data because of the original application to sea urchin studies, the framework is actually relatively generic, and should be able to store and present a variety of types of perturbation data. Please contact us if you think that some modifications to the framework would make it match your needs.
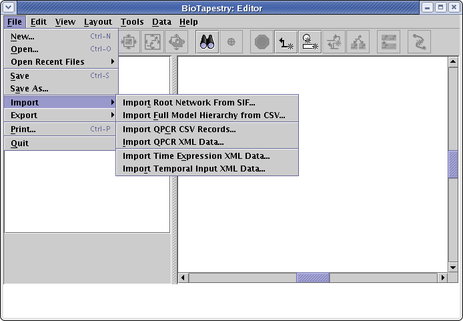
No. While you can enter and edit raw perturbation ("QPCR"), temporal/spatial expression, and temporal input data using dialogs (available off the Data option on the main menu), the picture below highlights that there are several data file import options you can use instead. If you have raw perturbation ("QPCR") data, you can import it using either an XML data format or using two different comma-separated value (CSV) formats. The temporal/spatial expression and temporal input data can be imported using XML data files. To learn about this, work through the Dynamic Submodels Tutorial. Unfortunately, there is currently not a formal file format definition for these two files (e.g. a DTD). The two sample data files that come with the tutorial, the Time Course Data File and the Temporal Input Data File, provide good examples of these input files that you can use to build your own, though the latter does not show how to specify a repression input. The following file snippet shows how to do that:
<temporalRange name="Gene 6" note="">
<inputTimeRange input="Gene 4">
<range region="A" minTime="4" maxTime="5" sign="repress" />
</inputTimeRange>
</temporalRange>
The experimental data display that appears when you right-click on a gene and select Experimental Data is configured using a "plug-in" architecture that can be customized by the user. Without modification, BioTapestry will use its built-in plugins to display:
![]() Raw perturbation ("QPCR") data
Raw perturbation ("QPCR") data
![]() Temporal/spatial expression data
Temporal/spatial expression data
![]() Temporal input data
Temporal input data
![]() Plain text (actually very simple HTML: it supports italic, bold,
paragraph, and line break tags). To enter this text, right-click on a gene, choose Properties..., and select
the Text Annotations tab.
Plain text (actually very simple HTML: it supports italic, bold,
paragraph, and line break tags). To enter this text, right-click on a gene, choose Properties..., and select
the Text Annotations tab.
![]() Very simple web pages specified by URLs (described below)
Very simple web pages specified by URLs (described below)
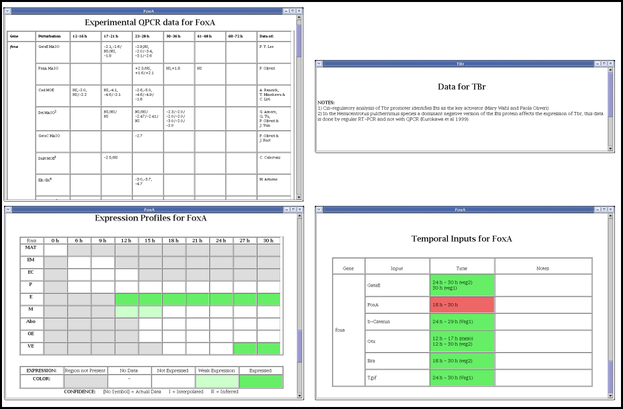
The first four of these different types of built-in displays are shown below:
As the last entry above indicates, starting in Version 3, the Experimental Data display can show very basic web pages. To enter a series of URLs, right-click on a gene, choose Properties..., and select the Data URLs tab as shown below:
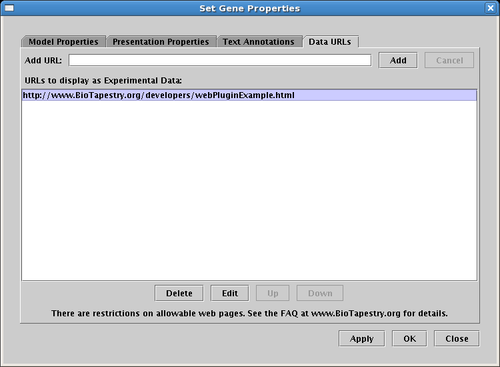
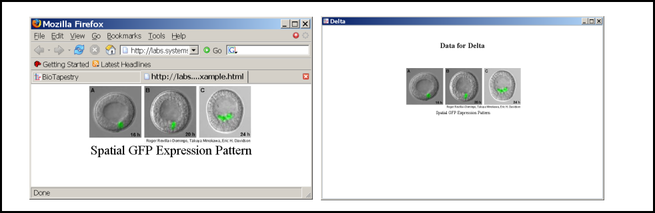
The web page specified by the URL will then appear in the data display. As shown below, the left window is a web browser, the right window shows how this web content is incorporated into the BioTapestry Experimental Data window:
The dialog notes there are certain web page restrictions, which are listed below. The design intent is that a lab using this feature would set up a web server that hosts a very basic page or set of pages for each gene or node of interest. It is not intended to provide a mechanism to show arbitrary pages off the web, as it is unlikely that the following restrictions would be met.
![]() These web pages should just use very basic HTML, e.g. italic, bold, paragraph, line break, and simple
table tags. Do not reference pages containing Javascript or that use Cascading Style Sheets. The web page creator should keep in mind that
the bodies of each separate web page in the list will be excised and inserted in the given order into the single web page displayed by the Experimental
Data window.
These web pages should just use very basic HTML, e.g. italic, bold, paragraph, line break, and simple
table tags. Do not reference pages containing Javascript or that use Cascading Style Sheets. The web page creator should keep in mind that
the bodies of each separate web page in the list will be excised and inserted in the given order into the single web page displayed by the Experimental
Data window.
![]() Embedded images in the page should be specified using absolute URLs.
Embedded images in the page should be specified using absolute URLs.
![]() There should not be any embedded hypertext links. The Experimental Data display does
not support even basic web navigation, so clicking on a link is a one-way trip.
There should not be any embedded hypertext links. The Experimental Data display does
not support even basic web navigation, so clicking on a link is a one-way trip.
![]() If you are creating a set of pages to be used by a network that
you are going to share over the web using the BioTapestry Viewer (as opposed to the Editor), they must be located on the
same web server as the one hosting the Viewer. There are security restrictions imposed by Java that prevents an unsigned
program (such as the Viewer) from accessing any web server except the one it originated on. Since the BioTapestry Editor
is signed, it is not restricted in this fashion.
If you are creating a set of pages to be used by a network that
you are going to share over the web using the BioTapestry Viewer (as opposed to the Editor), they must be located on the
same web server as the one hosting the Viewer. There are security restrictions imposed by Java that prevents an unsigned
program (such as the Viewer) from accessing any web server except the one it originated on. Since the BioTapestry Editor
is signed, it is not restricted in this fashion.
The new URL option probably provides you with enough flexibility to display what you need, but if you want to add additional custom data displays to the experimental data window, there are example plug-ins in the source code tree, which is available here.
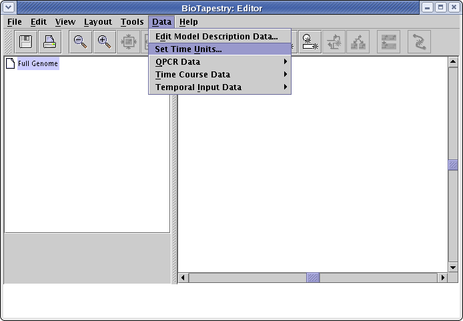
Starting with version 2, users are no longer restricted to using hours for the time units. Units from seconds to years are available. Also, the user can specify numbered or customed named stages as the time units. Before you enter any time-dependent data, you are required to set these units. You can do this by selecting Data->Set Time Units... from the main menu:
There are a few different methods for tagging genes and individual links with graphical symbols that can be used to indicate confidence levels and/or experimental evidence, as the following picture shows:
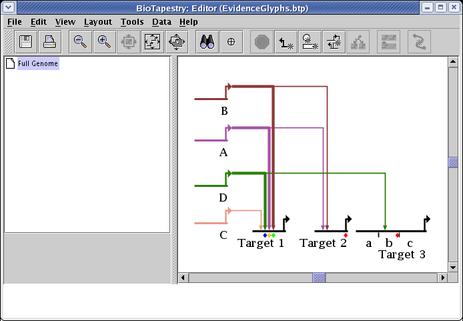
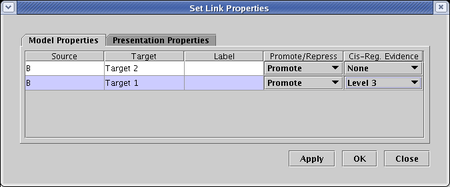
As shown above by the links that are inbound to the gene Target 1, individual links can be assigned ten different "evidence level" tags. The ten available "levels" have no predefined semantics; the user can use these designations to mean anything they wish. To assign a level to a link, right-click on the link tree, select Properties... from the pop-up menu, and go to the Cis-Reg. Evidence column of the table on the Model Properties tab. Then you can set the evidence from None up to Level 10 for each different link in the tree. When you are done, click OK:
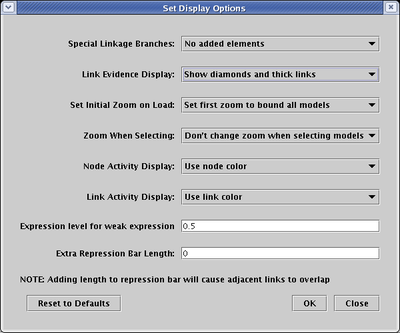
Note that the display of the different link evidence levels can actually take two forms: target diamonds and thick links. Which of these methods is used to show link evidence can be configured as a display option. From the main menu, select Edit->Set Display Options.... In the dialog, as shown below, set the Link Evidence Display to the desired setting. In this case, the setting Show diamonds and thick links uses both methods, as shown in the network pictured above. You can also choose either method, or hide the evidence display completely.
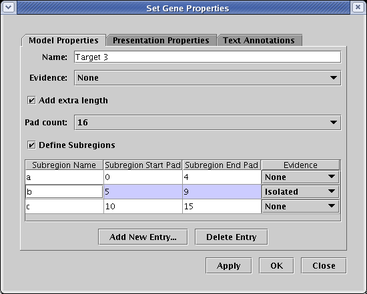
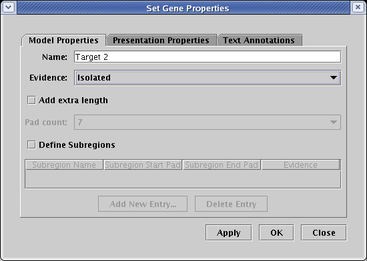
Genes, such as Target 2 in the above network, can also be tagged with an evidence glyph, which again can be used to mean anything the user wishes (though BioTapestry uses the term Isolated when the glyph is selected). To set the evidence level for a gene, right-click on the gene, and set the Evidence level on the Model Properties tab: .
Finally, if you have defined cis-regulatory regions for a gene, you can tag each region with an evidence tag. Region b of the Target 3 gene in the above network has been tagged in this fashion. To set the evidence level for a region, right-click on the gene, and set the Evidence level for each row in the Subregions table on the Model Properties tab: