|
|
|
|
|
|
|
|
Building a Two-Layer Model Hierarchy from Interaction Tables
Using Layout Tools to Rearrange the Network
Adding a Third Level Using Interaction Tables
Entering Features Incrementally in a Bottom-Up Fashion
Note: This is the version of the Tutorial on Building Networks from Interaction Tables with full-size screen shots. To get the version with reduced-size images, go here.
The introductory Quick Start Tutorial showed how you can construct a multi-level model hierarchy in BioTapestry by drawing a top-level model and then deriving submodels using a series of point-and-click operations. The Dynamic Submodels Tutorial covered how to create dynamic submodels from a set of experimental data tables.
BioTapestry can also build and layout networks automatically from lists of interactions. This automatic network building feature allows you to create network hierarchies without needing to do any drawing. This functionality is what allows BioTapestry to serve as an effective visualization tool at the end of an automatic network generation pipeline, and also makes it possible to create very large network visualizations that are impossible to create manually. Another tutorial, Building Networks from Comma-Separated Value Files, demonstrates how networks can be built automatically from a comma-separated value (CSV) input file, using the same underlying functionality that is covered here. This tutorial shows how to build networks by specifying the interactions using interactive dialogs.
Even though BioTapestry can layout networks automatically, in many cases manually laid out networks with well-planned organization can provide a more intuitive understanding of the model than those created by the automatic layout engine. And almost always you can improve upon the automatic layout by shifting things around a bit. To make it easier to do this manual layout, there are several tools that can help you with common network layout tasks, and those will also be demonstrated in this tutorial.
Building networks from interaction tables differs from drawing because construction can occur either top-down or bottom-up. When drawing models, you first need to create the top-level model, then push those features down to the submodels. However, when creating networks from dialogs, you can specify the lower-level models first, and the top-level model will be automatically built as the union of all the network elements created in the lower-level models. Alternately, you can build the top level model and then choose which interactions to include in the submodels. This tutorial will demonstrate both techniques.
Before starting to build a model from interaction tables, it is important to understand how BioTapestry currently deals with these tables. In particular, the information contained in the tables is considered the definitive description of all the elements in the network. The drawn networks are then derived from these definitive definitions. Adding new genes, nodes, links or regions by drawing them or propagating them does not add them to the interaction tables, nor does deleting them from the drawing remove them from the tables. Any changes made to network layout (e.g. moving nodes or rerouting links) can be retained if you desire, but you need to add or remove interactions using the tables to make any lasting changes to the basic definition of the network model.
Thus, once you choose to build a network from interaction tables, you should continue to use this method to build and modify the network definition. If you wish to abandon this approach and use drawing thereafter, you can select Tools->Drop All Interaction Tables Used to Build Networks from the main menu; the drawn versions of the networks will then be the definitive network definition. If you import network definitions from files (such as the CSV files), this also creates an underlying definition in the interaction tables, and you should use this deletion step if you wish to modify the imported network model by using drawing operations.
It is anticipated that a future version of BioTapestry will relax this restriction and make the information flow between drawing operations and the interaction table entries bidirectional.
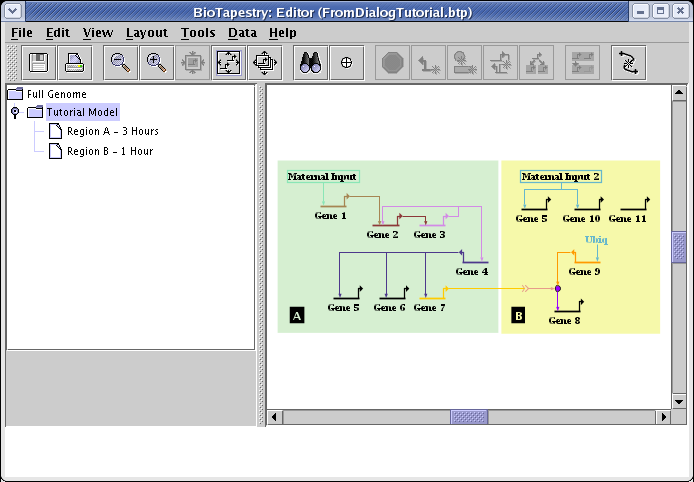
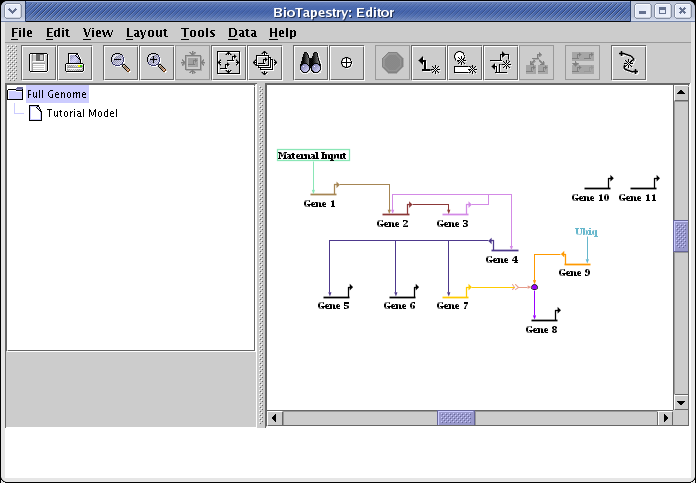
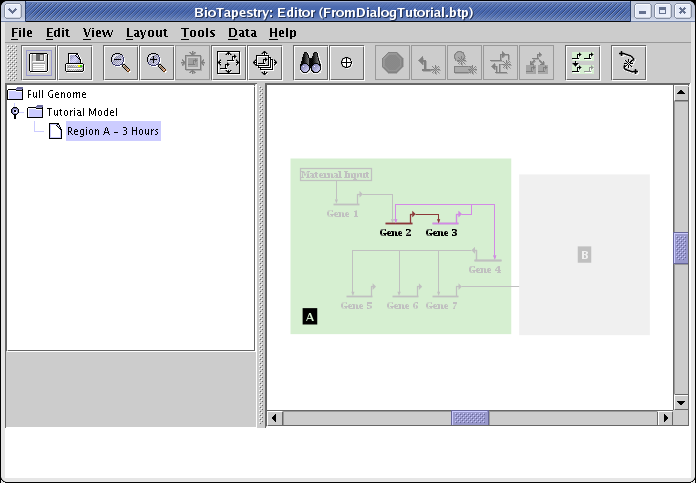
This tutorial will create the model shown below using interaction tables. Since we can construct models from the bottom up, we will start by creating the Tutorial Model, which will also automatically create a consistent Full Genome model at the same time. After creating that two-layer model heirarchy, we will then add the two submodels below the Tutorial Model:
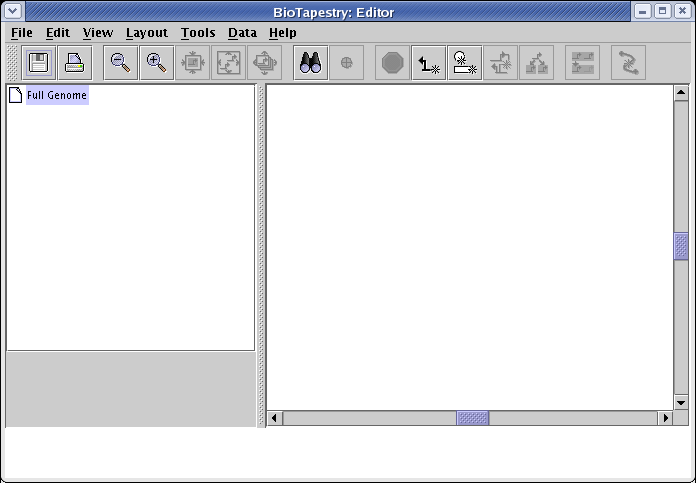
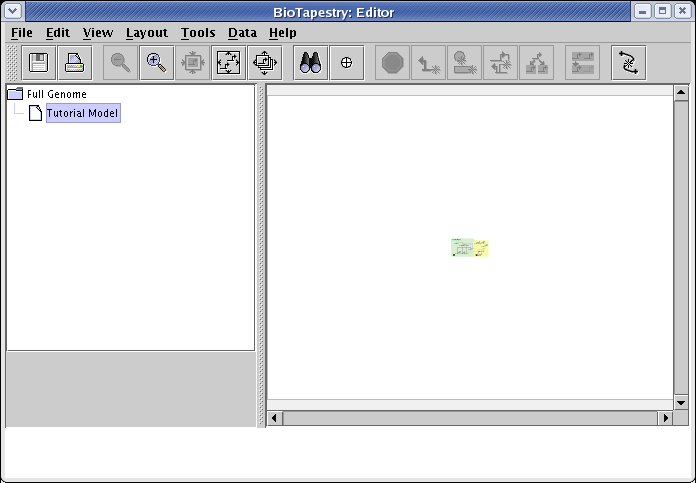
Start with an empty network. Either start up BioTapestry from scratch, or select File->New... from the main menu if you have been previously working on another network:
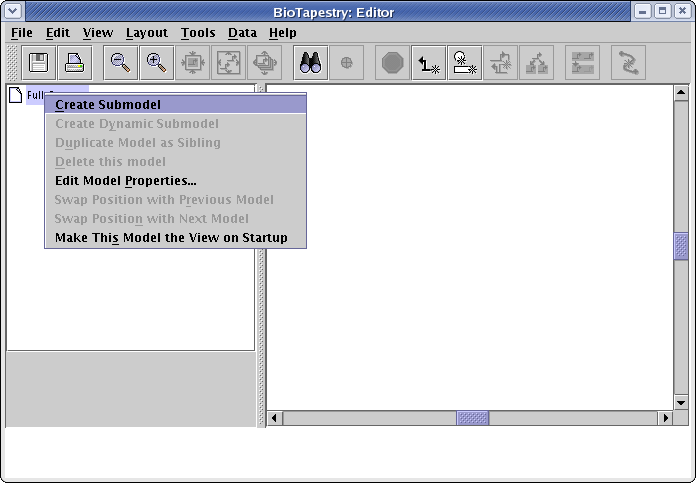
Now create a submodel of the root model by right-clicking on the Full Genome entry in the left navigation panel, and select Create Submodel from the menu (Note to Mac users: if you're using a one-button mouse, press the Control key while clicking the mouse whenever you are directed to do a "right-click"):
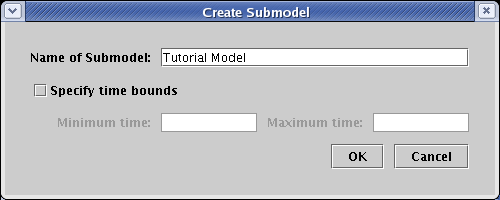
For Name of Submodel, type in Tutorial Model. Don't bother specifying time bounds. Click OK:
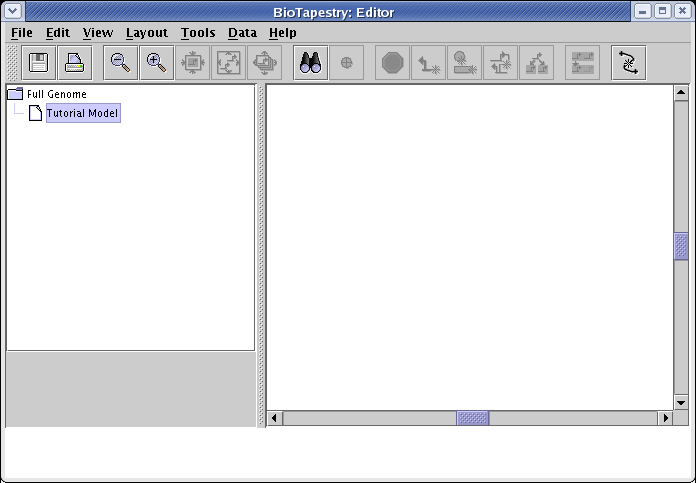
You now have a hierarchy of two empty models. Make sure you have selected Tutorial Model:
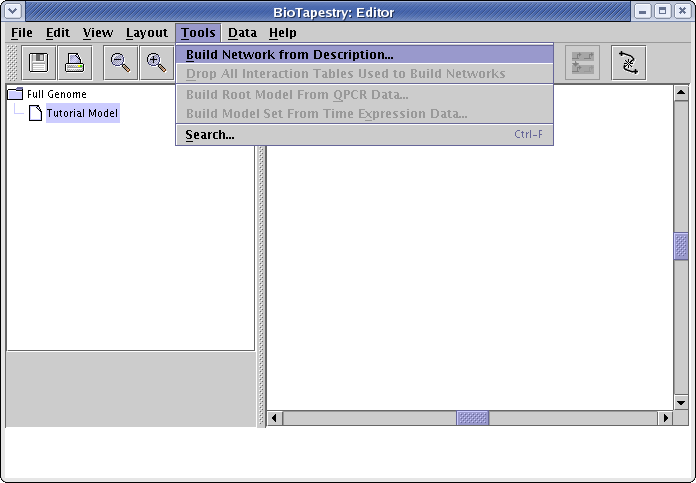
Now instead of drawing elements like nodes and links to populate the models, select Tools->Build Network from Description... from the main menu:
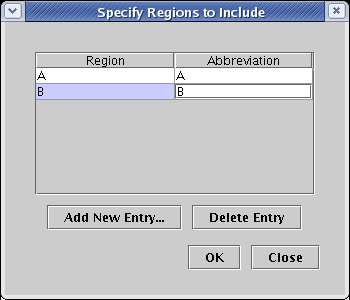
Unless you are building the Full Genome model, you will now get a dialog box asking for the regions to include. (If you do not get this dialog, you should select Close and then make sure that you have first selected Tutorial Model in the left navigation panel.) Click the Add New Entry... button twice and add regions A and B. Usually the region name is longer than three characters, so you also need to enter a unique abbreviation for each region. Here we just use the same characters. Once the regions are entered, click OK:
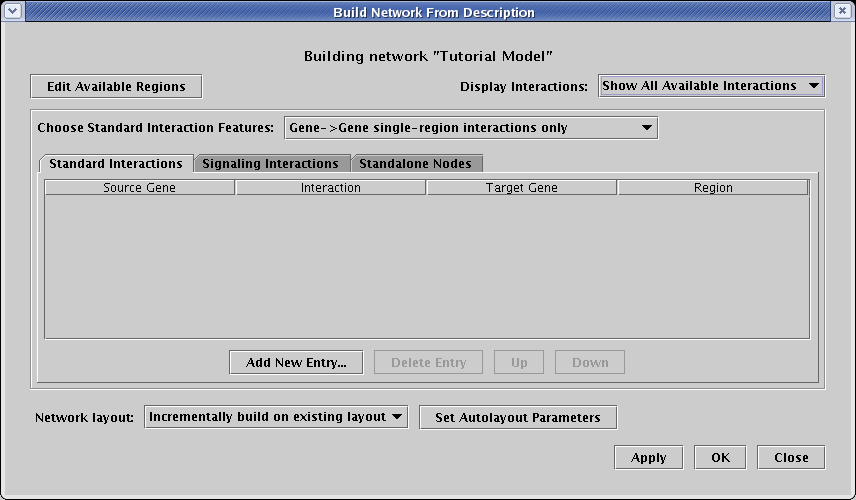
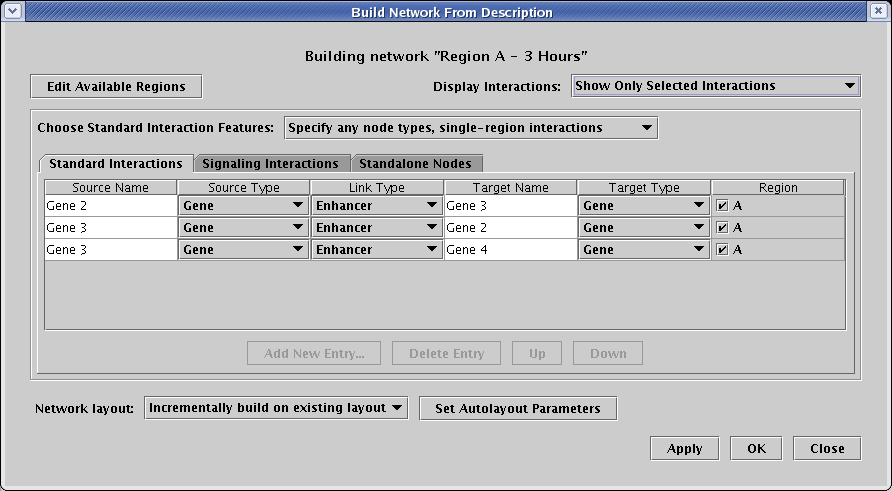
This brings up the Build Network from Description dialog, shown below. There are a few important things to note about this dialog:
![]() There are three tabs for entering different types of interactions,
named Standard Interactions, Signaling Interactions, and Standalone Nodes.
There are three tabs for entering different types of interactions,
named Standard Interactions, Signaling Interactions, and Standalone Nodes.
![]() There is a choice menu labeled Choose Standard Interaction Features.
You use this to set the level of complexity you wish to
work with on the Standard Interactions tab. The one shown, Gene->Gene single-region interactions only, is the simplest
format. If you are just interested in specifying simple interactions just between genes that occur in a single region, you choose that
setting. You can increase the complexity of the Standard Interactions table if you need to by choosing another setting.
For example, you would choose another setting if you needed to specify interactions with bubbles or boxes, or if you wanted
to have an interaction that went between regions (note that the latter case is typically handled instead by signals on the Signaling Interactions tab).
There is a choice menu labeled Choose Standard Interaction Features.
You use this to set the level of complexity you wish to
work with on the Standard Interactions tab. The one shown, Gene->Gene single-region interactions only, is the simplest
format. If you are just interested in specifying simple interactions just between genes that occur in a single region, you choose that
setting. You can increase the complexity of the Standard Interactions table if you need to by choosing another setting.
For example, you would choose another setting if you needed to specify interactions with bubbles or boxes, or if you wanted
to have an interaction that went between regions (note that the latter case is typically handled instead by signals on the Signaling Interactions tab).
![]() There is a choice menu labeled Display Interactions. This controls
which interactions are shown in the tables. This setting
is particularly relevant when you are working with a submodel of an existing model. For example, you may want to see all possible
interactions, the interactions present in the parent model, or just the interactions that have been included in the current model.
There is a choice menu labeled Display Interactions. This controls
which interactions are shown in the tables. This setting
is particularly relevant when you are working with a submodel of an existing model. For example, you may want to see all possible
interactions, the interactions present in the parent model, or just the interactions that have been included in the current model.
![]() There is an Edit Available Regions button to modify the regions
that are included in the current model.
There is an Edit Available Regions button to modify the regions
that are included in the current model.
![]() There is a clear title to let you know which model you are working on.
There is a clear title to let you know which model you are working on.
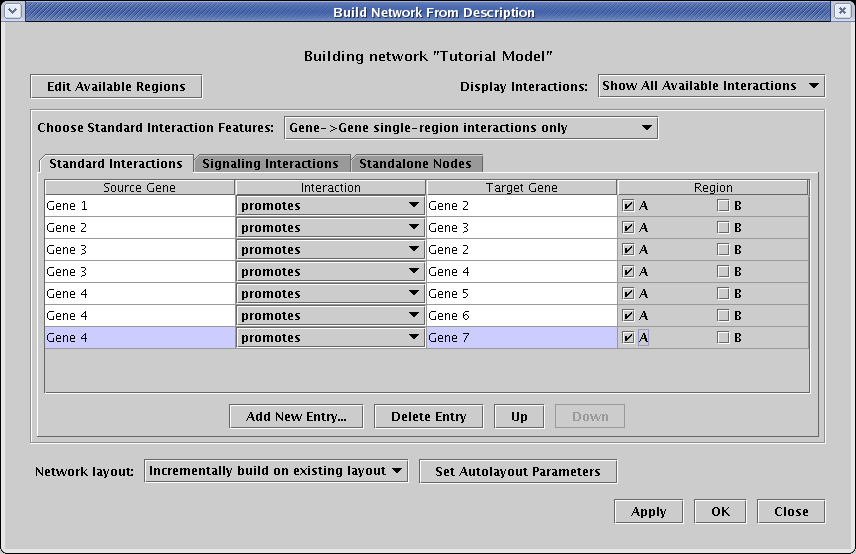
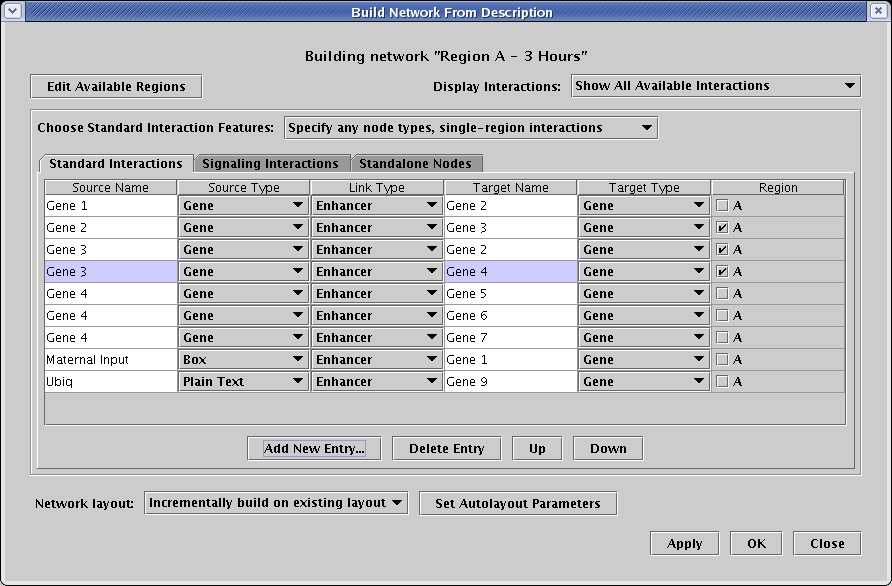
Make sure you have selected the Standard Interactions tab, and have chosen to work with Gene->Gene single-region interactions only. Begin by clicking the Add New Entry... button seven times, and enter the following interactions. As shown, they all should be set as promotes, and they all should be included in only region A:
| Source Gene | Interaction | Target Gene | Region |
|---|---|---|---|
| Gene 1 | promotes | Gene 2 | A |
| Gene 2 | promotes | Gene 3 | A |
| Gene 3 | promotes | Gene 2 | A |
| Gene 3 | promotes | Gene 4 | A |
| Gene 4 | promotes | Gene 5 | A |
| Gene 4 | promotes | Gene 6 | A |
| Gene 4 | promotes | Gene 7 | A |
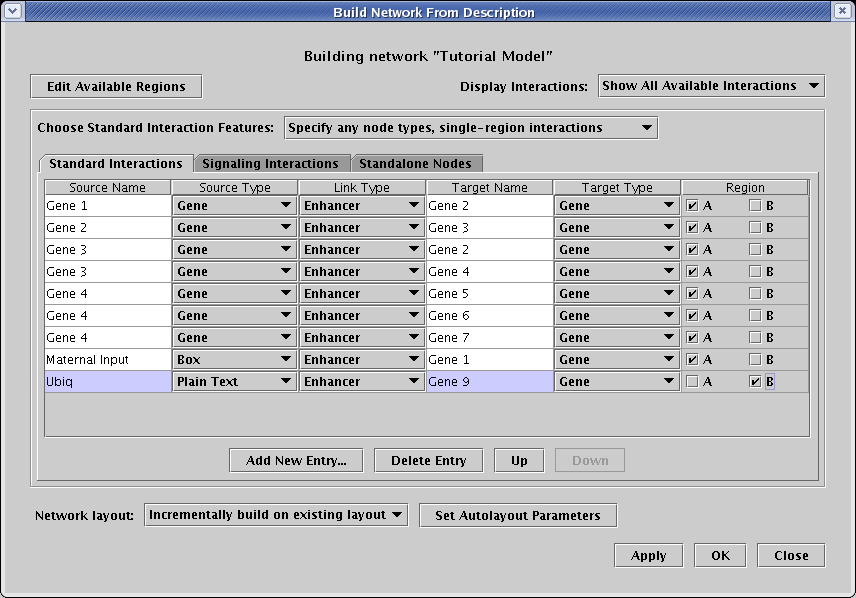
Actually, we have more than just gene->gene interactions in this network; we also need to create interactions with boxes and plain text. So change the setting of Choose Standard Interaction Features to Specify any node types, single-region interactions. Note that the table gets more complex, adding a node type column for both the source and target. Add the following two new entries (note how the last interaction is in region B!):
| Source Name | Source Type | Link Type | Target Name | Target Type | Region |
|---|---|---|---|---|---|
| Maternal Input | Box | Enhancer | Gene 1 | Gene | A |
| Ubiq | Plain Text | Enhancer | Gene 9 | Gene | B |
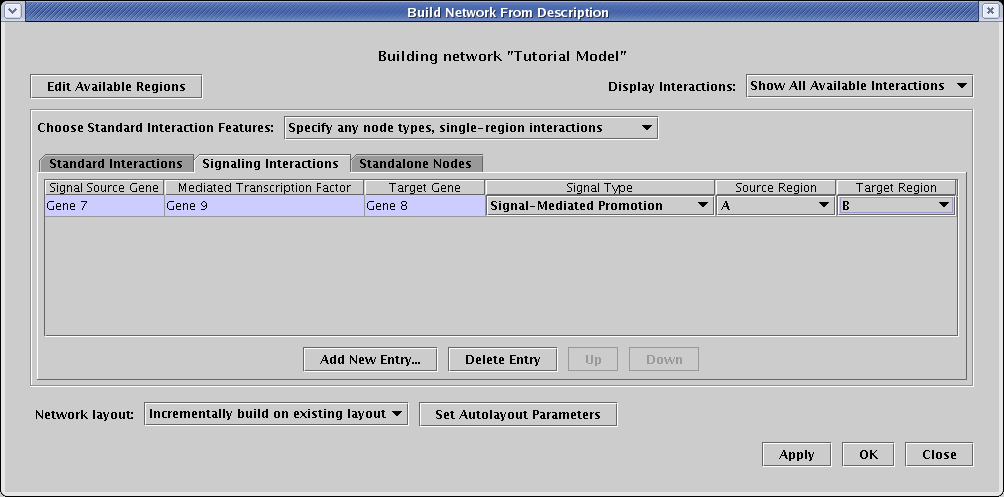
This model also includes a signal from region A to region B. To include that, select the Signaling Interactions tab, and create a single new entry with the following values:
| Signal Source Gene | Mediated Transcription Factor | Target Gene | Signal Type | Source Region | Target Region |
|---|---|---|---|---|---|
| Gene 7 | Gene 9 | Gene 8 | Signal-Mediated Promotion | A | B |
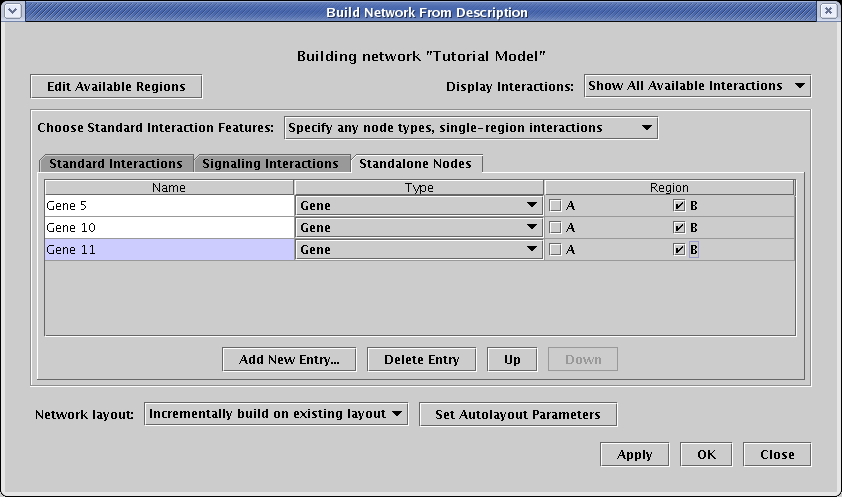
To complete the network, we have three genes that we know express in region B, but we do not yet know how they interact with other genes. These are examples of standalone nodes. To add these to the network, select the Standalone Nodes tab, and add these three new entries:
| Name | Type | Region |
|---|---|---|
| Gene 5 | Gene | B |
| Gene 10 | Gene | B |
| Gene 11 | Gene | B |
Note that although you need to specify the type of node for Gene 5, since it already has been defined in another table, the type would automatically be set once you typed in the node name and exited the field. Since the type defaults to Gene anyway, you don't see this happening; but be aware the system is enforcing consistent node type specifications across all tabs as you edit the interaction definitions.
After you have entered the last interaction, click the OK button to now build the network:
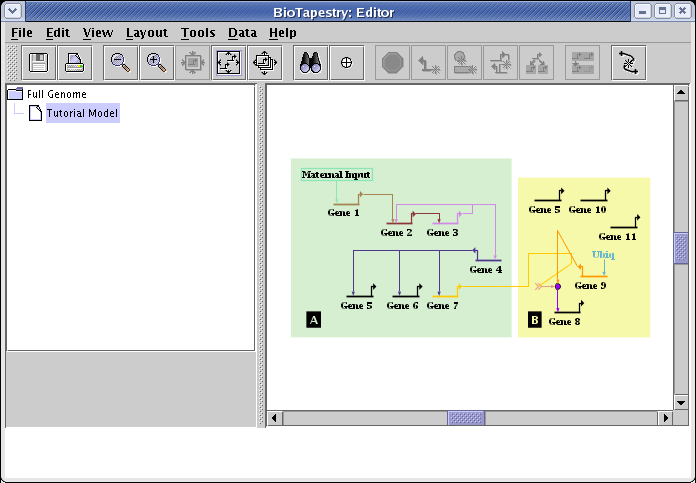
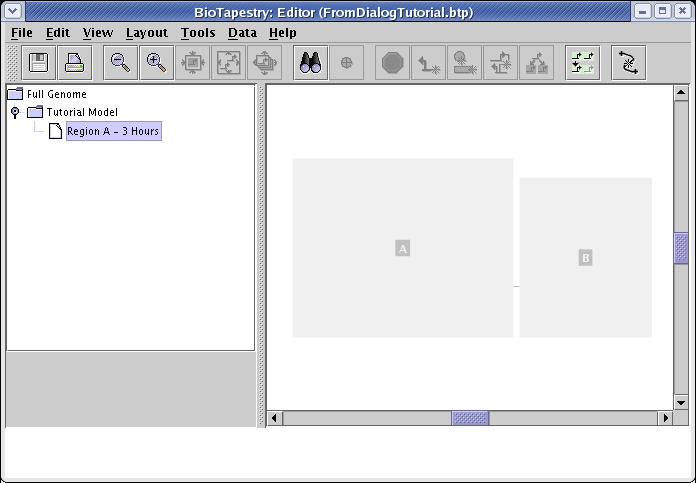
You should now see the network shown in the figure below. The automatic layout algorithm tries to lay out the network in a hierarchical fashion from left to right, both within a region and between regions:
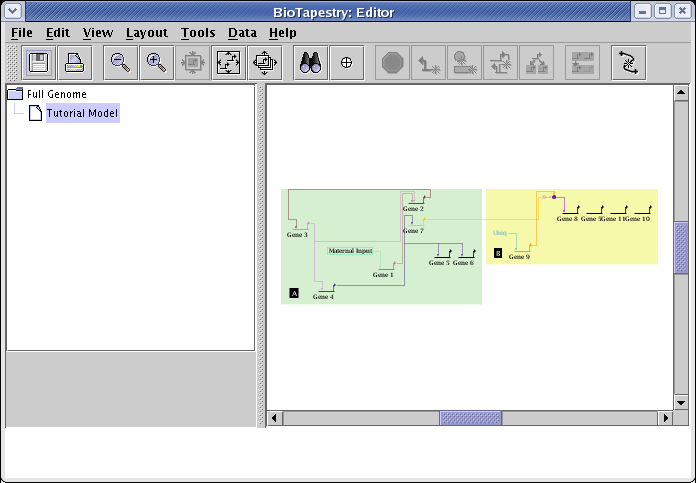
Since the layout algorithm has no information about the biological semantics of your network, you will frequently want to shift nodes around and create a network layout that clarifies or emphasizes certain network features or properties. In the next section of the tutorial, we will cover some of the layout support tools to help you tweak your layouts.
The layout of the Full Genome model is completely independent of the layouts you create for the submodels. If you make major changes to a layout, it can be a lot of work to make other models in the hierarchy have similar layouts. To support this process, BioTapestry has a Synchronize All Layouts tool. A current limitation of this tool is that it can only propagate the Full Genome layout to all the other layouts. So to use this feature, you need to work on the Full Genome layout.
So, begin by selecting the Full Genome model:
The desired layout for the Full Genome model is shown below. You will first need to drag the genes and nodes around to the locations shown in the diagram. Don't worry about reorganizing the links; you will be using the automatic link layout tool to clean those up shortly:
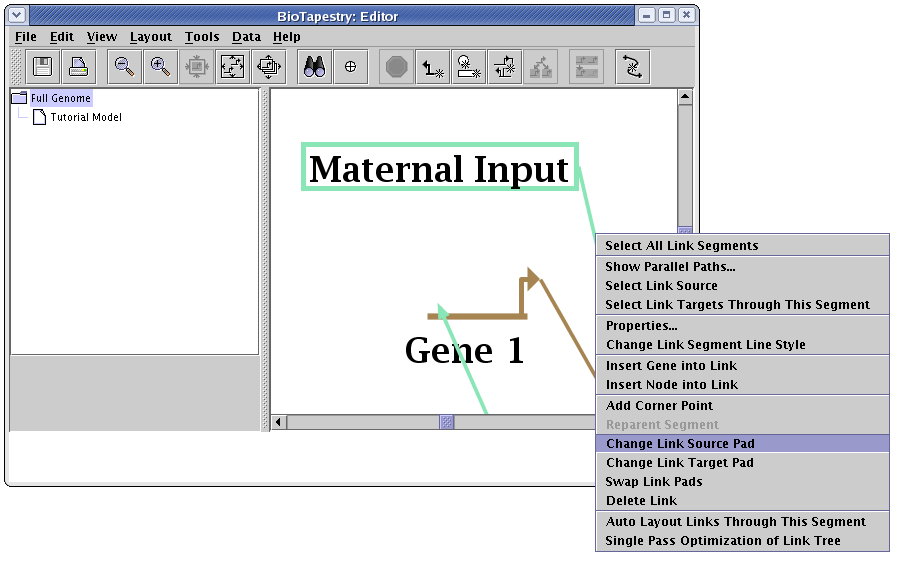
The automatic link layout tool preserves the source and target pads for links. If you want those changed to improve the layout, that needs to be done manually. There are three links that need to be changed in this model. The first is the link from Maternal Input to Gene 1. As shown below, right-click on the link out of the Maternal Input node, select Change Link Source Pad, and click on the bottom pad of Maternal Input with the crosshair cursor. (If you need more information on changing link pads, this is covered in the Reorganizing Links section of the QuickStart Tutorial.)
Following that pad change, also fix the output from the bubble node leading into Gene 8 so it departs from the bottom of the bubble, and change the Ubiq output into Gene 9 so it departs from the bottom of the Ubiq node.
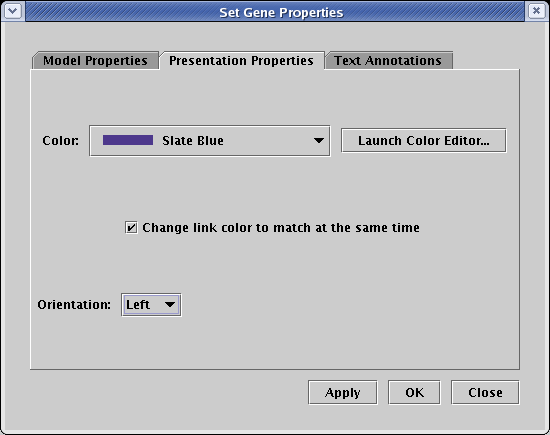
After making the pad changes, note that the orientations of both Gene 4 and Gene 9 need to be flipped to create the desired layout. For each gene, right-click on the gene, select Properties... to bring up the dialog box, select the Presentation Properties tab, set the Orientation to Left, and click OK:
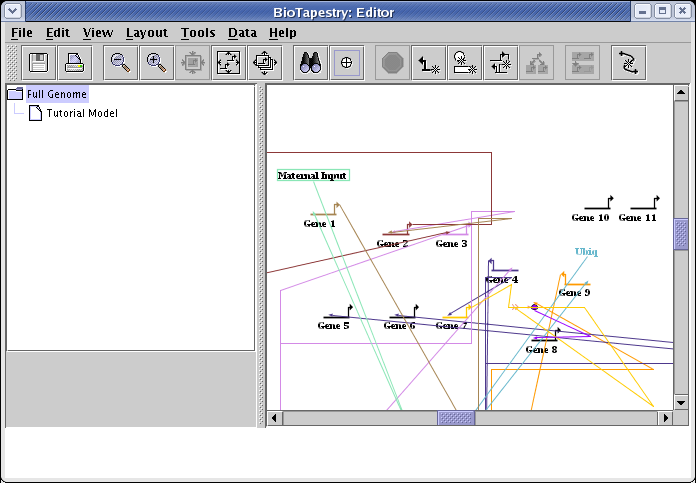
Once all these changes have been made, the network should look something like this mess:
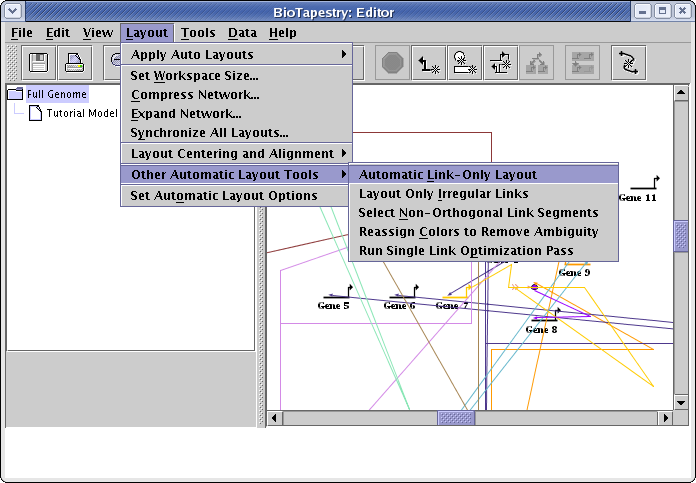
To clean up the links, go to the main menu and select Layout->Other Automatic Layout Tools->Automatic Link-Only Layout:
For large networks, you may have to wait for several seconds for the link layout to complete. However, for this small network, the operation should finish quickly, giving a network that looks something like this:
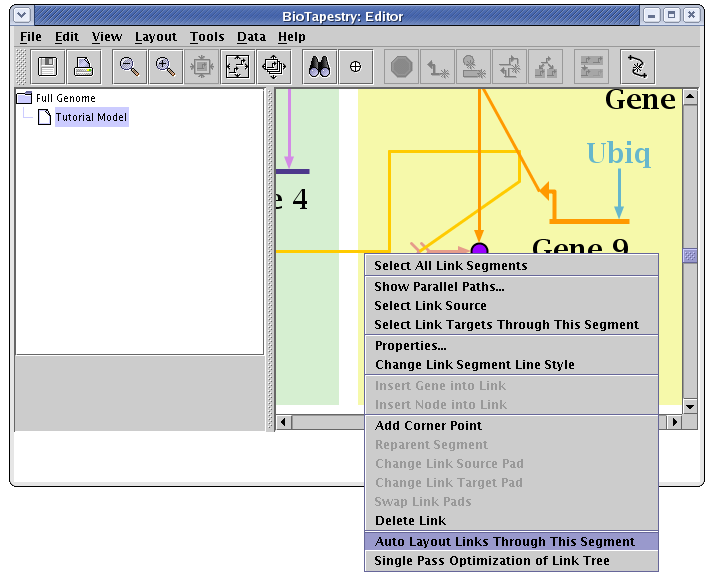
If you did not line up all the nodes exactly right, you might end up with small doglegs in the links. To deal with this, nudge the nodes as needed and iterate the automatic link layout step. For tweaking just a portion of a link tree, you can also right-click on a given link and select Auto Layout Links Through This Segment.
Since this is a small network and the links are straightforward, the links do not need any further cleanup. However, with a complex network, the first-pass automatic link layout algorithm may leave artifacts that should be eliminated by running one or more link optimization passes after automatic link layout. You can run such an optimization pass by selecting Layout->Other Automatic Layout Tools->Run Single Link Optimization Pass. Do this as many times as you need to get the cleanup you want. (Quickly toggling Undo and Redo is a nice way to visualize the differences.) Since global link optimization may change manually laid out links in an undesirable way, you can restrict the optimization to a given link tree by right-clicking on the link and selecting Single Pass Optimization of Link Tree from the pop-up menu. (Unfortunately, you cannot currently restrict optimization to just a portion of the link tree; the entire tree may be modified by this step.) Remember, if the link optimization step makes an undesirable change, you can always perform an Edit->Undo to back the change out.
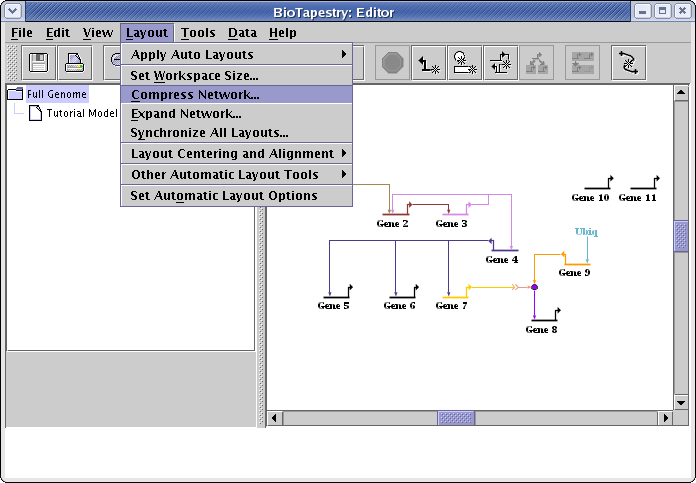
It is often the case that after manually repositioning the nodes in a network and cleaning up the link routing, there is extra space in the network that can be squeezed out without changing the basic organization of the layout. To remove this excess space, go to the main menu and select Layout->Compress Network...:
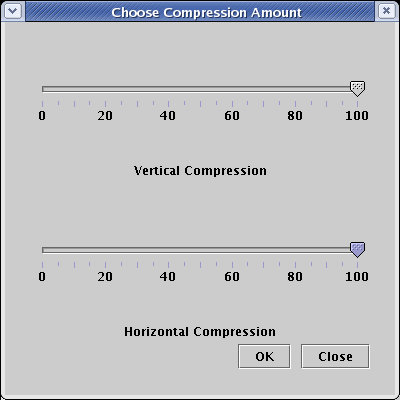
A dialog box appears that allows you to select different levels of compression for the horizontal and vertical directions. Network layout in BioTapestry is based on a fine-grained grid, and full compression (100) will remove all the grid rows or columns in the layout that are devoid of any significant geometric content. (Note that all genes and other nodes are surrounded by some extra padding that will not be deleted even at 100 percent compression.) In this case, select settings of 100 for both directions and press OK:
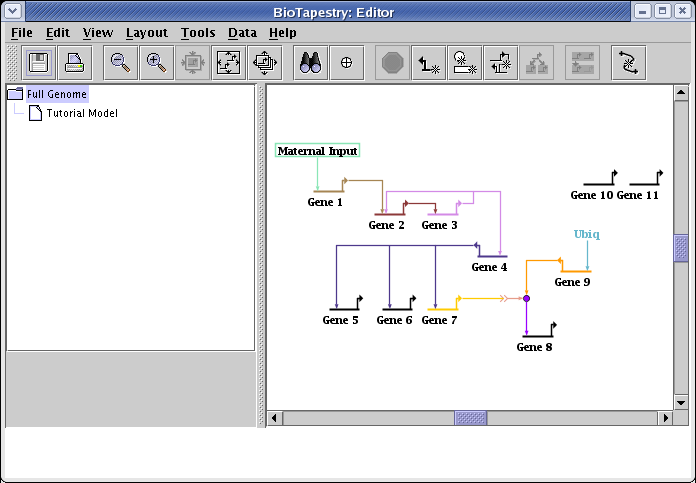
Following the compression step, we have completed our rearrangement of the root layout, as shown below. Note that a roughly opposite operation to expand the network is also available by selecting Layout->Expand Network..., but these are not purely inverse operations, in that a 100% compression followed by 100% expansion does not get you back to the same state.
The next step will be to synchronize the layout in the submodel with this layout. Select Layout->Synchronize All Layouts... from the main menu:
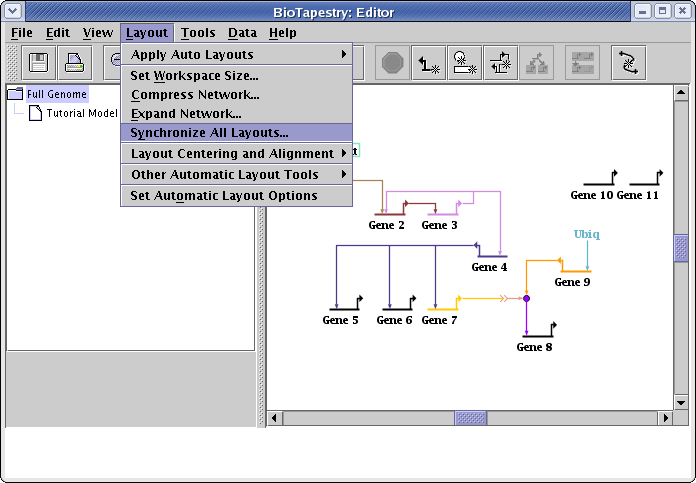
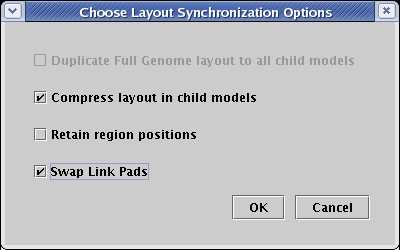
You are then presented with a dialog box that offers either three or four options. In some cases, you are offered the choice Duplicate Full Genome layout to all child models. That choice will only be active if every submodel of the top-level network has at most one copy of every top-level element. In that case, the top-level layout can be used unchanged by all the child models. Note that since there are two copies of Gene 5 in the Tutorial Model submodel, this condition is not met here, and so the option is not available.
If the direct copy option is unavailable, or if you choose not to select it, then the following two options are made available. The first, Compress layout in child models, runs the network compression algorithm (the same one you used above) separately for the network contained in each different region of a submodel. This can remove lots of empty space that may remain after each region is initially laid out based upon a direct copy of the Full Genome. In this example, there would be a lot of wasted space between Gene 5 and the other elements in region B, so put a checkmark next to this option to activate it and get a more compact layout for region B.
The third option, Retain region positions, will force the layout synchronization algorithm to retain the relative positions of the regions that currently exist in each submodel. Unfortunately, this option often causes the link trees containing a link running between the regions to become rather disorganized; so frequently you want to leave this option off and let the program automatically assign region positions. Make sure it is unchecked now.
The last option, Swap Link Pads changes link pad assignments in all the submodels to match the Full Genome model. This is usually desirable, so be sure there is a checkmark next to this option to activate it. When the dialog looks like the one shown below, click OK:
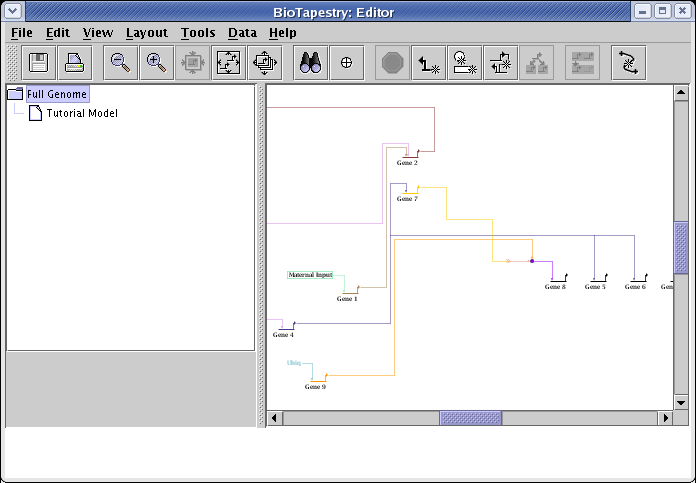
Now select the Tutorial Model. You will note that the Full Genome layout has been applied to each region of the submodel, although the empty space that would have been present in region B has been compressed away, as requested. Links between the regions, like the link from Gene 7 to the signal chevron, are then laid out automatically:
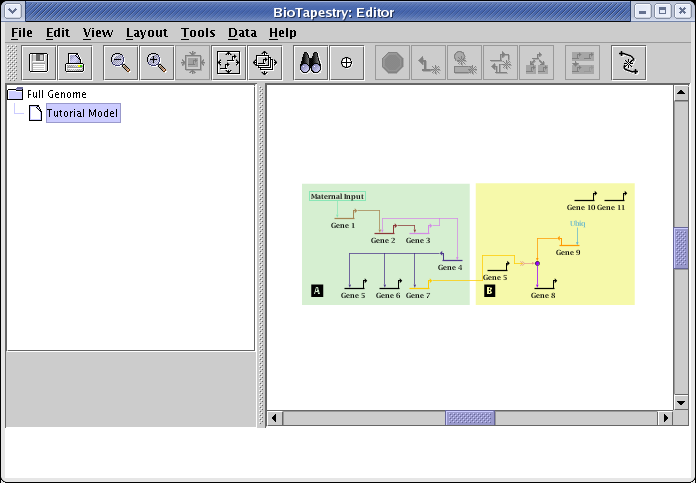
After synching the layouts, you still frequently need to tweak the layouts to provide the best organization. In this case, we want to shift Gene 5 to the top, and shift the signaling subnetwork over to the left. To shift multiple nodes and links at once, drag a rubber band box around the group of nodes and links (as shown below) and then release the mouse button; this selects everything inside the box. You will then be able to drag those selected elements around as a unit.
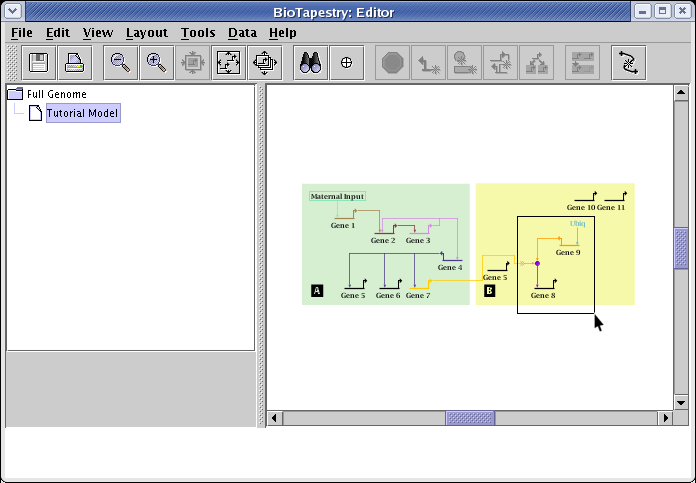
After moving everything around, you should have something like this:
To fix the layout of just the signal link, right-click on that link and select Auto Layout Links Through This Segment:
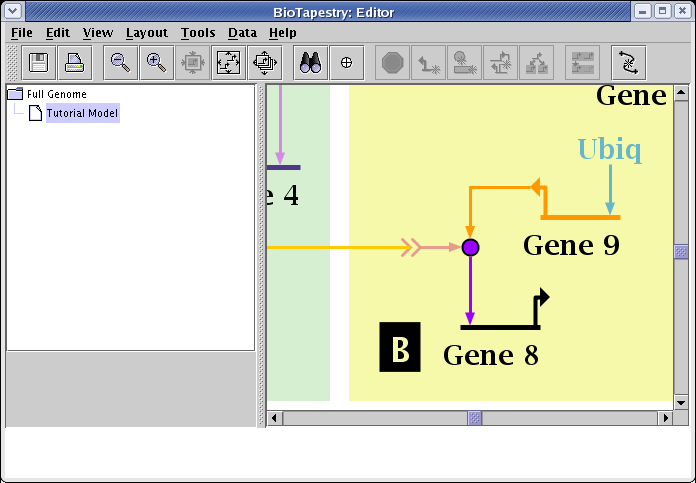
Also do that step to the link out of Gene 9, and you should be left with a clean organization of the links:
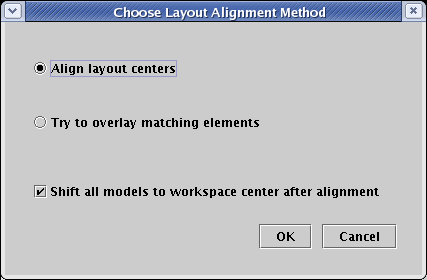
After you have been modifying and reorganizing the layouts of several different models, you usually want to position the different independent network layouts so that they all overlay each other as closely as possible. A tool to help you do this is available by going to the main menu and selecting Layout->Layout Centering and Alignment->Align Centers of All Model Layouts...:
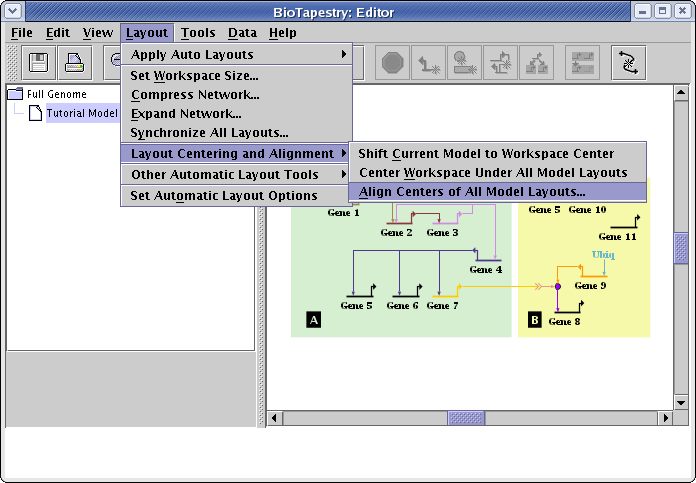
This brings up a dialog box with two mutually exclusive options for aligning all the different network views. You can choose to either Align layout centers or Try to overlay matching elements. The former is useful when your collection of layouts is rather dissimilar, and you just want to overlay the geometric centers of all the layouts. The latter is useful when the layouts are similar, and it is possible to find significantly identical portions of each layout and match them up. You also can have all the layouts centered in the workspace when they are aligned, which is a useful option that should usually be checked. For this tutorial, select the Align layout centers option, and click OK:
The view zooms out so you can see that the models have been centered in the available workspace. If you zoom in to the model and move between the two models, you will see they have been approximately aligned with each other:
If you haven't saved your work yet, now is a good time to do it. This example has been saved as FromDialogTutorial.btp.
The first section of this tutorial created a two-level model hierarchy, starting at the lower model. Now, we will show how to use interaction tables to create a new submodel under an existing model hierarchy (i.e. a top-down approach).
Begin by right-clicking on the Tutorial Model entry in the left navigation panel, select Create Submodel from the menu, enter Region A - 3 Hours for Name of Submodel in the dialog that pops up, and click OK. Then select the new model in the navigation panel, and you will see the newly created empty model:
Now go to the main menu and choose Tools->Build Network from Description.... You will get the dialog box shown below for specifying the regions that you want to include in this new model. It differs from the previous version you saw in this tutorial, because here you are asked to choose from only those regions that are currently present in the parent model. Note that if you want to introduce a new region into this submodel that will be propagated upward (thus allowing you to build your model hierarchy from the bottom up if you choose), you will be able to do that momentarily by clicking the Edit Available Regions button in the upcoming main dialog. For this model, check region A and hit OK:

The dialog that appears shows you all the possible interactions that you can include in this submodel. It's always a good habit to check the Building network... title at the top to remind yourself which model you are currently modifying; it's easy to get lost sometimes. To include an interaction in this submodel, you put a check in the Region box; if the box is unchecked, that interaction is not included. Now select only the three interactions shown in the following table by checking the A box in the Region column:
| Source Name | Source Type | Link Type | Target Name | Target Type | Region |
|---|---|---|---|---|---|
| Gene 2 | Gene | Enhancer | Gene 3 | Gene | A |
| Gene 3 | Gene | Enhancer | Gene 2 | Gene | A |
| Gene 3 | Gene | Enhancer | Gene 4 | Gene | A |
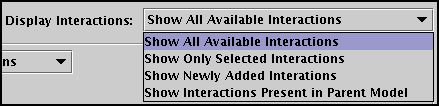
The other six interactions shown in the table (as well as the interactions appearing on the other tabs) should be left unchecked, and it is essential to understand that these rows should not be deleted from this table. That would globally remove those interactions from all the models in the hierarchy! To understand why, it is crucial to understand the meaning of the Display Interactions selection in the upper right, shown in detail in the figure below. You have four possible views:
![]() Show All Available Interactions: Every interaction present
in the top-level Full Genome model is shown, even if it is not present in the parent model. Checking a region
for an interaction will result in that interaction being newly included in all parent models if they are not already
there. Deleting the interaction will globally remove it from all models.
Show All Available Interactions: Every interaction present
in the top-level Full Genome model is shown, even if it is not present in the parent model. Checking a region
for an interaction will result in that interaction being newly included in all parent models if they are not already
there. Deleting the interaction will globally remove it from all models.
![]() Show Only Selected Interactions: Only interactions that
have been checked appear in the table. This gives you a condensed view of exactly what will show up in the current submodel.
Show Only Selected Interactions: Only interactions that
have been checked appear in the table. This gives you a condensed view of exactly what will show up in the current submodel.
![]() Show Newly Added Interactions: If you are adding new
interaction entries into the model at this level (which will cause them to be added to the top-level Full Genome model,
even if they do not have a region checked), this is a good way to track what has been newly added.
Show Newly Added Interactions: If you are adding new
interaction entries into the model at this level (which will cause them to be added to the top-level Full Genome model,
even if they do not have a region checked), this is a good way to track what has been newly added.
![]() Show Interactions Present in Parent Model: If you want
to make sure you are working only with those interactions present in the parent model (i.e. you are building top-down)
use this setting to limit your view of possible interactions.
Show Interactions Present in Parent Model: If you want
to make sure you are working only with those interactions present in the parent model (i.e. you are building top-down)
use this setting to limit your view of possible interactions.
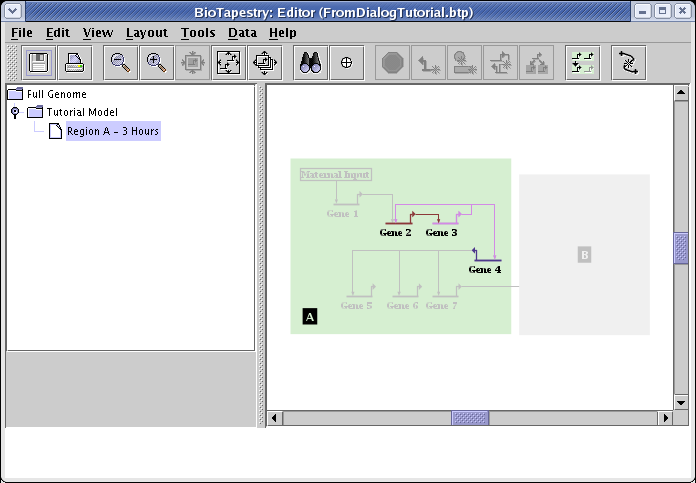
So after checking off the A boxes in the Region column for the three interactions, and then setting Display Interactions to Show Only Selected Interactions, you will see just the three interactions that will appear in the new submodel:
Before submitting the changes to populate the submodel, make sure that the Network Layout option is set to Incrementally build on existing layout (it should already be set to this by default). If you do not have that option selected, the entire set of existing layouts will be discarded and automatically rebuilt, which is not what you want in this case. Then click OK, and you should see the following network:
Unfortunately, in the current version of BioTapestry, not all model features can be specified using the interaction lists. For example, say that we wanted to show the input to Gene 4 as active in this model, but show the target Gene 4 as not yet expressing. You cannot do this via the interaction lists; you need to do it after the network is built. Right-click on Gene 4 and select Properties... from the menu:
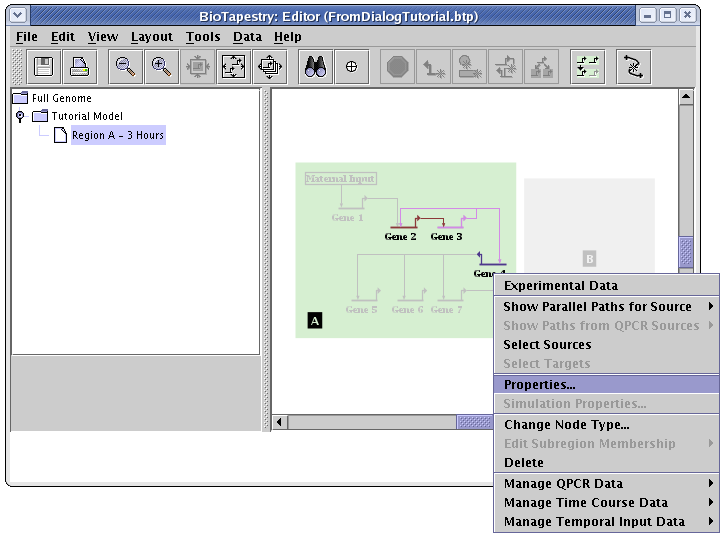
On the Model Properties tab of the dialog, set Activity to Inactive and click OK:
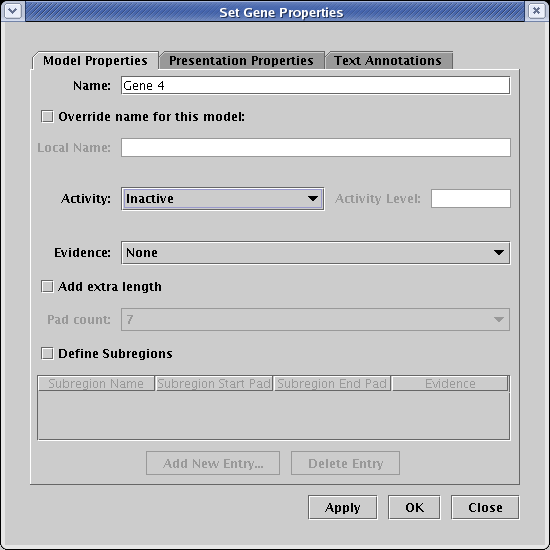
Your final network would then look like this, with an inactive Gene 4. Unfortunately, this setting will not be retained by BioTapestry if you then rebuild the hierarchy again using the Build Network from Description... tool! This is a critical shortcoming, which needs to be addressed in a future version of BioTapestry. In the meantime, be aware that modifications like this need to be redone if you use Build Network from Description... again after making those changes.
In the last section, we populated a new submodel by including a few interactions that already existed in the parent model. In this section, we will create a new submodel and populate it with completely new interactions that are then propagated up through the model hierarchy (i.e. bottom-up hierarchy construction).
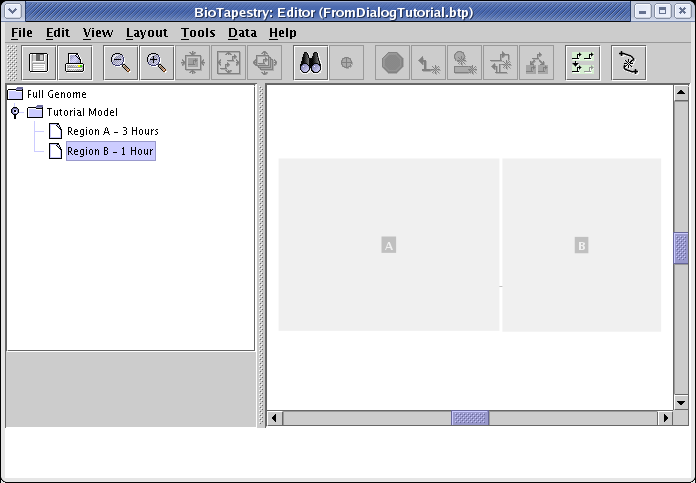
Begin by right-clicking on the Tutorial Model entry in the left navigation panel, select Create Submodel from the menu, enter Region B - 1 Hour for Name of Submodel in the dialog that pops up, and click OK. Then select the new model in the navigation panel, and you will see the newly created empty model:
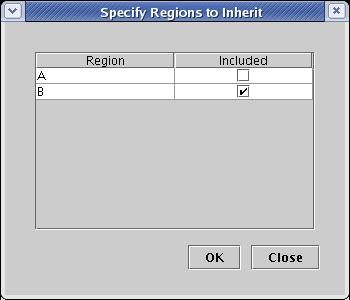
From the main menu, choose Tools->Build Network from Description..., check the box to include region B in the dialog that appears, and click OK:
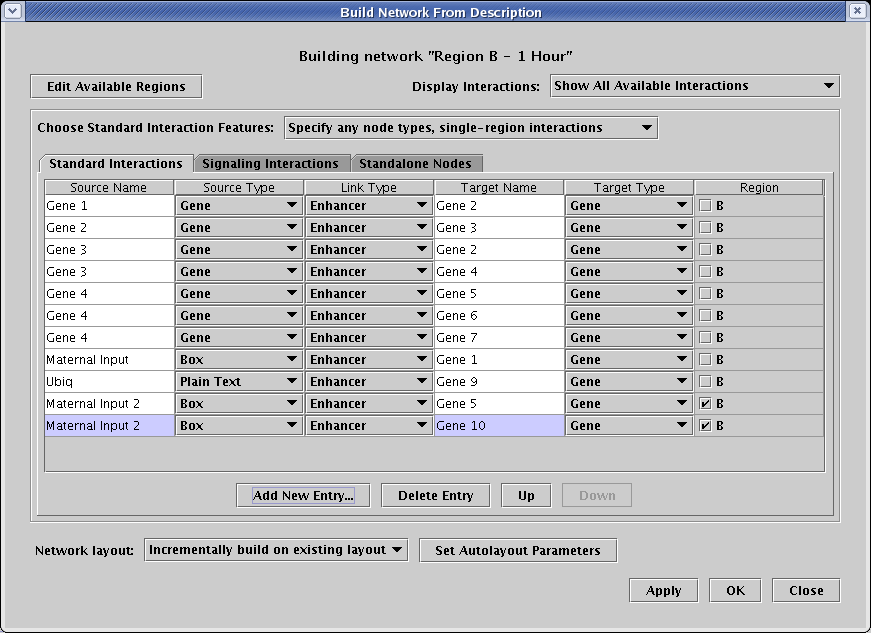
For this submodel, we are going to add two new interactions from a new Maternal Input 2 box node that only appear in region B. One will target Gene 5, and the other will target Gene 10. Both of these genes are already present, though Gene 10 only appears in the Standalone Nodes tab.
On the Standard Interactions tab, click the Add New Entry... button twice. Add the two new interactions shown below. If you recall, it was mentioned above that the program tracks the node types of previous entries and checks to make sure that node types are consistently specified. Thus, after you enter the name Maternal Input 2 the second time, the Source Type setting should pop to Box automatically after you click anywhere out of the Source Name text field.
| Source Name | Source Type | Link Type | Target Name | Target Type | Region |
|---|---|---|---|---|---|
| Maternal Input 2 | Box | Enhancer | Gene 5 | Gene | B |
| Maternal Input 2 | Box | Enhancer | Gene 10 | Gene | B |
Just like in the previous submodel, only check the B box in the Region column for the two interactions to include, and leave all the others alone. You can always set the Display Interactions option to Show Only Selected Interactions to see just what is going into the current model.
Also, you can just leave the Gene 5 and Gene 10 entries alone in the Standalone Nodes table. Having superfluous entries there doesn't matter. But if you were to start deleting these entries, you would want to make absolutely sure that other submodels weren't depending on them to populate standalone instances of each node (they aren't in this case).
Once these entries are complete, and you are sure that the Network Layout option is set to Incrementally build on existing layout, click OK:
The resulting network has the new features added in incrementally. The existing layout was not completely preserved; note that region B was expanded and shifted to accomodate the new additions, and the inter-region link needed to be laid out again:
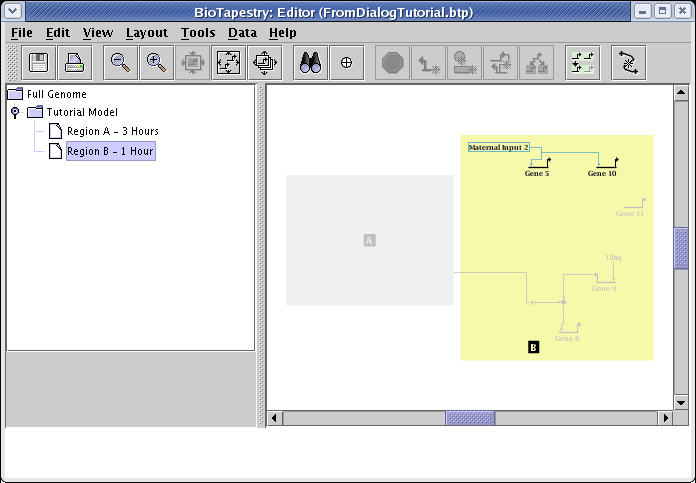
Note that the location of the new features in the submodel was derived from where they were added to the top-level Full Genome model. You can see this if you select the Full Genome model, as shown below. Sometimes it makes sense to use the Layout->Expand Network... tool one or more times on the top-level layout before incrementally adding new features, since sometimes the extra space helps to fit the new features in. In this case that wasn't necessary:
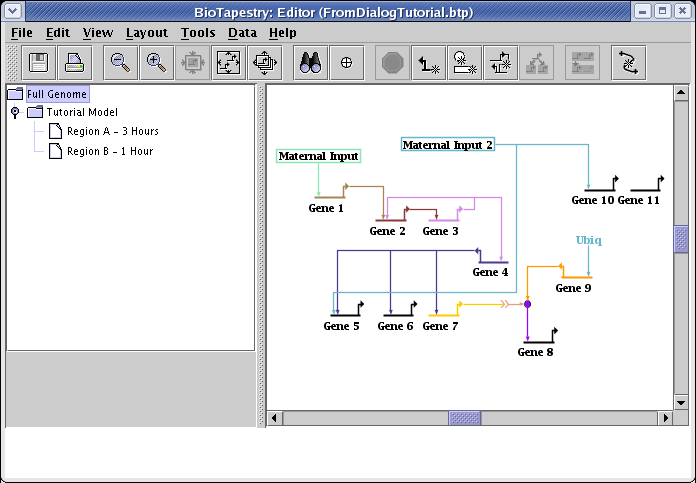
After adding new features incrementally, you usually need to tweak things to get the final desired layout. Here is the final result after manual clean-up. And remember that since you have used the Build Network from Description... tool since setting Gene 4 to inactive in the Region A - 3 Hours submodel, that change was lost, and you unfortunately need to go back and set that again...
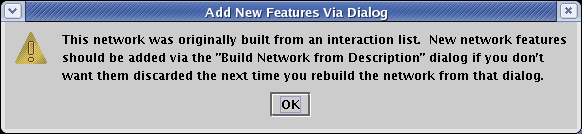
At the start of the tutorial, it was pointed out that if you use interaction tables to build the network, those tables become the definitive description of the network, and subsequent additions and deletions to the model need to be made via those tables. If you now go and try to add a new gene to the network via drawing, you will see the following warning: