|
|
|
|
|
|
|
|
Note: This version of FAQ Answers: Modeling Issues shows reduced-size screen shots. You can click on any image and see the full-size image in a separate window. To get the version with full-size images, go here.
Here are some rules, tips, and pointers for naming genes, nodes, and regions:
![]() A gene has to be assigned a unique name.
A gene has to be assigned a unique name.
![]() When deciding if two names are equal, the match ignores
embedded whitespace and is case-insensitive (e.g. A NODE == anode).
When deciding if two names are equal, the match ignores
embedded whitespace and is case-insensitive (e.g. A NODE == anode).
![]() The names of non-gene nodes (bubble, boxes, etc.) do not have
to be unique (e.g. you can multiple independent nodes named Ubiq), but they cannot share a name with a gene.
The names of non-gene nodes (bubble, boxes, etc.) do not have
to be unique (e.g. you can multiple independent nodes named Ubiq), but they cannot share a name with a gene.
![]() If you are tying the network genes, nodes, and regions to underlying
data tables (e.g. raw perturbation, time course, or temporal input), your best bet is to assign unique names to
everything, and use the identical name in the data tables. If you don't, you can provide mappings to the
data, but that is much more involved. The topic of setting up mappings is covered in
this section of the
online tutorial on dynamic submodels.
If you are tying the network genes, nodes, and regions to underlying
data tables (e.g. raw perturbation, time course, or temporal input), your best bet is to assign unique names to
everything, and use the identical name in the data tables. If you don't, you can provide mappings to the
data, but that is much more involved. The topic of setting up mappings is covered in
this section of the
online tutorial on dynamic submodels.
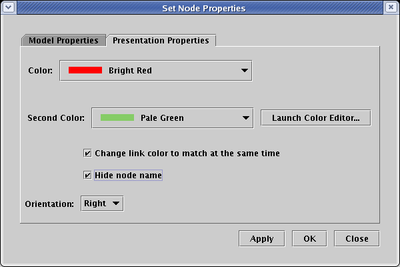
![]() If you don't want a non-gene node to have a name tag, it
can be nameless. However, particularly if you are tying nodes to underlying data tables, you are better off
giving the node a unique name and then hiding the name. To do this, right-click on the node, select Properties...
from the pop-up menu, select the Presentation Properties tab, click the Hide node name box, and click OK:
If you don't want a non-gene node to have a name tag, it
can be nameless. However, particularly if you are tying nodes to underlying data tables, you are better off
giving the node a unique name and then hiding the name. To do this, right-click on the node, select Properties...
from the pop-up menu, select the Presentation Properties tab, click the Hide node name box, and click OK:
![]() If you want a name to have a superscript suffix, you can use the
carat symbol(^) to denote the suffix.
If you want a name to have a superscript suffix, you can use the
carat symbol(^) to denote the suffix.
![]() Long names (> 11 characters) will be broken at whitespace across
multiple lines for every node and gene type except boxes and plain text. If this is undesirable, the current workaround
is to replace the whitespace with dashes (-) or underscores (_).
Long names (> 11 characters) will be broken at whitespace across
multiple lines for every node and gene type except boxes and plain text. If this is undesirable, the current workaround
is to replace the whitespace with dashes (-) or underscores (_).
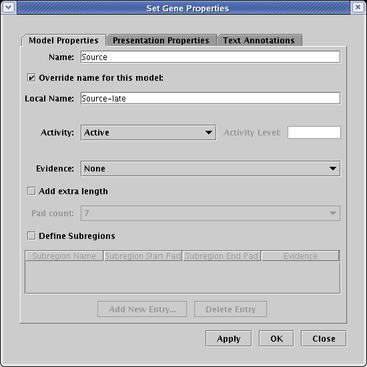
![]() If a gene or node needs to have a different name in a submodel
from the name used in the top-level Full Genome model, it can be overridden. To do this, right-click on the
gene or node, select Properties... from the pop-up menu, and on the Model Properties tab, click the
Override name for this model box, type the name into the Local Name field, and click OK:
If a gene or node needs to have a different name in a submodel
from the name used in the top-level Full Genome model, it can be overridden. To do this, right-click on the
gene or node, select Properties... from the pop-up menu, and on the Model Properties tab, click the
Override name for this model box, type the name into the Local Name field, and click OK:
![]() Regions need to have unique names within a given model. An empty
region name is valid.
Regions need to have unique names within a given model. An empty
region name is valid.
Yes, greek characters are supported, though typing the characters in can be problematic. An easy way to enter a greek character is to copy it from the following table and paste it into the gene or node name field:
| Letter | Uppercase | Lowercase |
|---|---|---|
| Alpha | Α | α |
| Beta | Β | β |
| Gamma | Γ | γ |
| Delta | Δ | δ |
| Epsilon | Ε | ε |
| Zeta | Ζ | ζ |
| Eta | Η | η |
| Theta | Θ | θ |
| Iota | Ι | ι |
| Kappa | Κ | κ |
| Lambda | Λ | λ |
| Mu | Μ | μ |
| Nu | Ν | ν |
| Xi | Ξ | ξ |
| Omicron | Ο | ο |
| Pi | Π | π |
| Rho | Ρ | ρ |
| Sigma | Σ | σ |
| Tau | Τ | τ |
| Upsilon | Υ | υ |
| Phi | Φ | φ |
| Chi | Χ | χ |
| Psi | Ψ | ψ |
| Omega | Ω | ω |
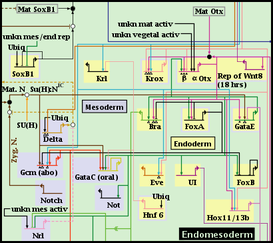
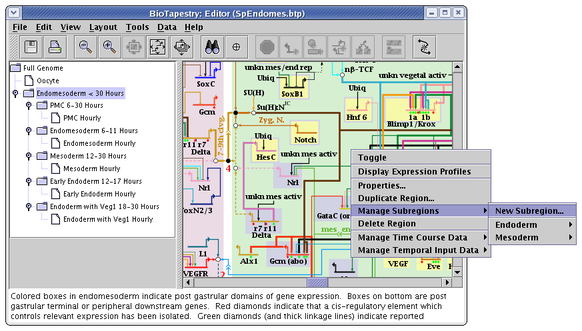
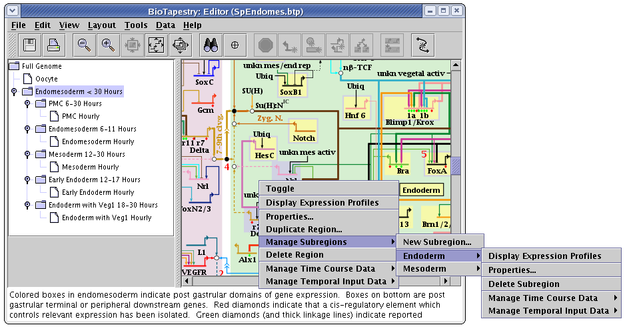
Every node or gene in a top-level instance model belongs to one and only one regular region. However, BioTapestry also allows the user to define any number of subregions within a regular region, where a node or gene in the region can belong to any number of subregions. For example, in the following piece of the endomesoderm model, the Endomesoderm region has two defined subregions: the Endoderm and the Mesoderm.
Subregions are created by right-clicking on an unoccupied part of the regular parent region and selecting Manage Subregions->New Subregion... menu. They can only be created in a top-level instance model, not in subset submodels:
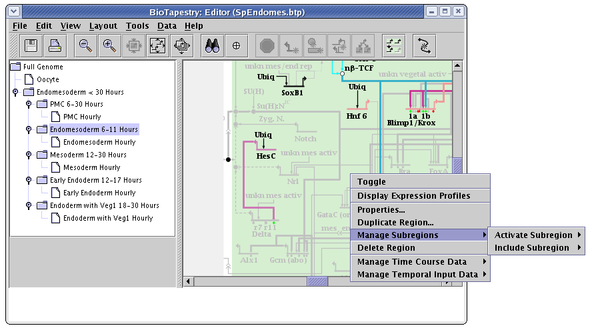
In a subset submodels, right-clicking on an unoccupied part of the regular parent region and selecting the Manage Subregions menu instead brings up two different submenu options: Activate Subregion and Include Subregion. Within each of these menus are listed the available subregions:
The difference between activating and including submodels can be understood from the following pictures. The first picture shows what a region with two defined subregions looks like when it is first propagated down into the submodel: no subregions are activated or included, so no subregions are shown:
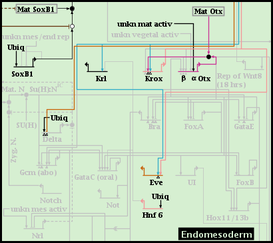
But after choosing to include the two subregions, they are both shown as well as the parent region:
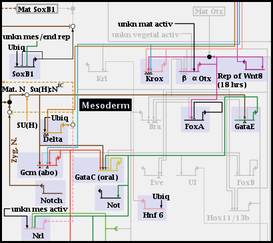
If you instead activate one of the subregions, the parent region is grayed out, and only the elements of the activated subregion are shown. Only one subregion can be activated at a time, and it must be deactivated before an alternate subregion can be activated instead:
Regardless of whether a subregion is in the top-level instance, or is included or activated in a subset model, it is managed by right-clicking on the parent region and selecting the Manage Subregions menu, as shown. The choices provided for managing subregions are very similar to those used for regular regions:
But there are differences in the properties dialog. First, the Pad settings refer to the size of the standalone color rectangles that surround each gene in the subregion. Second, each subregion is assigned a Layer, which determines which color rectangle shows up on top when a gene belongs to multiple subregions:
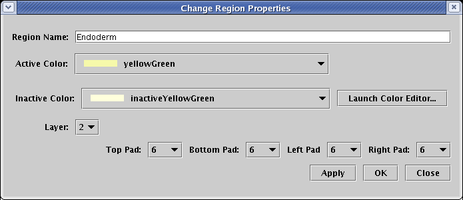
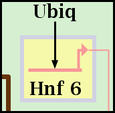
So, for the gene Hnf 6 show below, the blue Mesoderm subregion has been assigned to Layer number 2, with all Pad values set to 12. The yellow Endoderm subregion has been assigned to Layer number 1, with all Pad values set to 6. Note that only genes, and no other nodes, are bounded this way. Other nodes may belong to a subregion, but they do not get drawn with a colored subregion background:
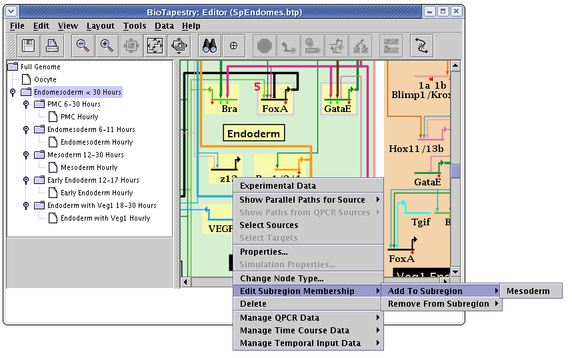
Once you have created subregions, genes and nodes are added to and removed from the subregions (again, only in the top-level instance model) by right-clicking on the node and then selecting the Edit Subregion Membership menu, as shown below. There you are given separate options to add or remove the node from subregions:
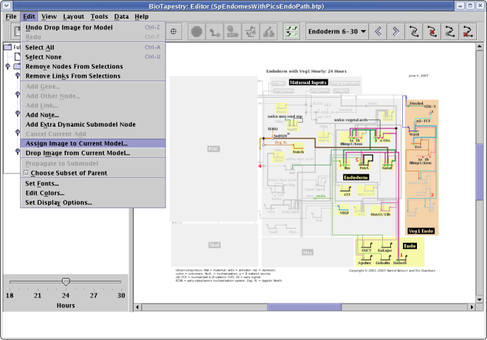
It's useful to be able to tie the abstract network representation back to a view of the organism that highlights the relevant domains being modeled. Starting with version 2.1, you can assign a PNG, GIF, or JPEG image to each different model in the hierarchy, including each separate time point in a dynamic model. This image is then displayed in the lower left of the application when the model is viewed. To assign a picture, select Edit->Assign Image to Current Model... and select the image file:
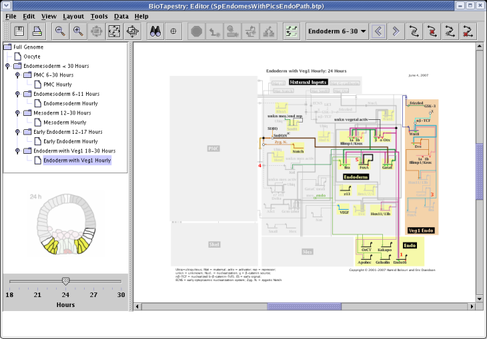
The result is shown below. Important Note: You can assign an image of any size to be displayed, and it will be scaled to fit the window. However, since this feature can quickly increase the size of your saved model file if you assign many large images, it is recommended to display only images that you have previously scaled to the actual display size (e.g. about 200 x 200 pixels) in a program like Photoshop. To save file space, the program will share a single image definition to save space if you assign identical images to different models.
Yes. The answer to the question about showing inactive nodes and links talks about how these elements can be shown completely on or off. But starting with Version 2, BioTapestry can display models with intermediate levels of activity. The activity level of nodes can be depicted using variable color saturation, a small pie glyph, or both. The activity level of links, on a per-link basis within a tree of links, can be depicted using variable color saturation, line thickness, or both. As a convenience, link activity levels can be tied to track the level of the source node, or they can be set explicitly.
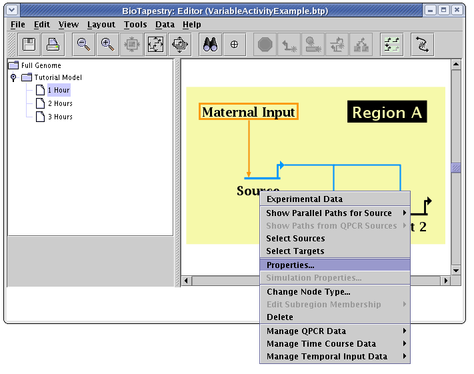
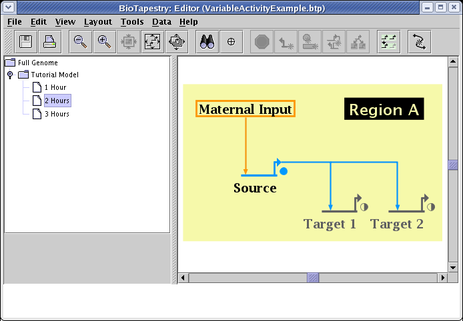
For an example of how to use this feature, we will use the model pictured below, and vary the activity level of three genes in each of the three submodels 1 Hour to 3 Hours. (Note that while we can set variable activity levels in all submodels, you cannot do this at the top-level Full Genome model.)

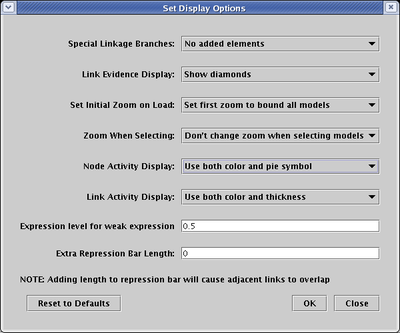
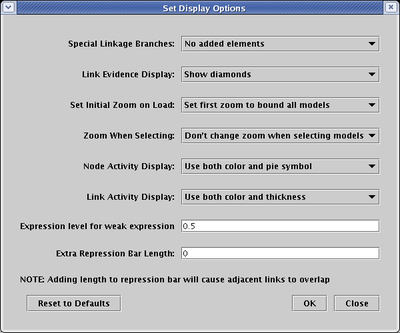
Before setting the activity levels, we will first pick the graphical techniques that will be used to show them. From the main menu, select Edit->Set Display Options.... In the dialog box, the settings for Node Activity Display and Link Activity Display control the presentation of variable activity. In this example, both options are set to use all the available techniques:
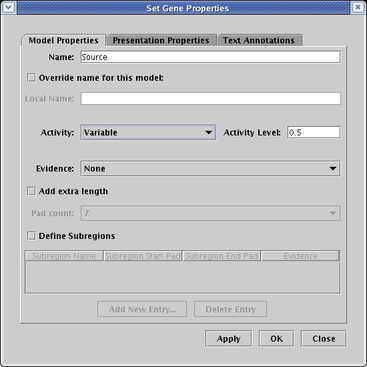
The first thing to do is to pick the submodel 1 Hour. Then, we bring up the node properties dialog for the Source gene by right-clicking on it and selecting Properties... from the menu:
On the Model Properties tab of the dialog, set Activity to Variable. This setting activates the adjacent Activity Level text box. The value in this box can be anywhere between 0.0 and 1.0, i.e. the activity levels are all normalized. In this example, the level is set to 0.5:
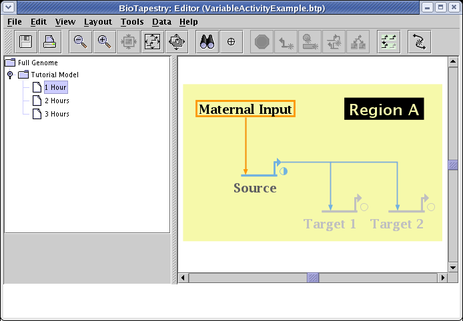
If the same steps are then repeated for the genes Target 1 and Target 2, with their levels set to 0.0, the 1 Hour submodel looks like the picture below. Note how the color of the genes is interpolated between the inactive gray color and the fully active color, and the small pie symbol indicates the normalized activity level. Since the links have not yet been set, they still display a fully active state:

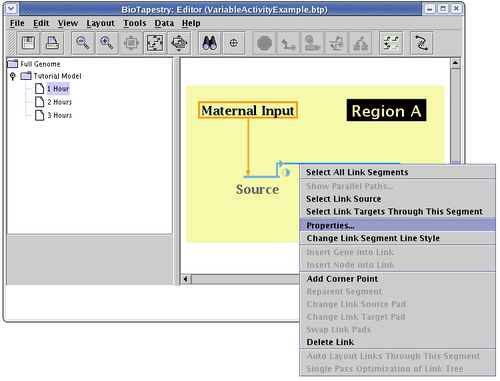
To set the link activity level, bring up the link properties dialog for the link by right-clicking on it and selecting Properties... from the menu:
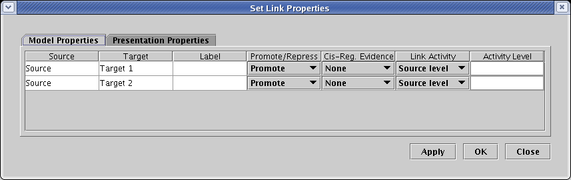
Each link in the link tree can have an independent setting for activity level, if desired. While the level can be explicitly set to a particular normalized value between 0.0 and 1.0, it is frequently the most convenient to tie the level to the source level. We do that in this example, where in the table on the Model Properties tab, the options in the Link Activity column are all set to Source level. (The explicit Activity Level setting field is not used in this case).
In the resulting 1 Hour submodel, the link color now matches the Source gene color, and the link thickness is reduced:
By picking the submodel 2 Hours, setting Source to 1.0, Target 1 and Target 2 to 0.5, and the link activity to match the source, you show the next stage of the series:
Finally, by picking the submodel 3 Hours, and making similar settings (except Target 1 and Target 2 are set to 1.0), you have the final stage of the series:

In the current version, this variable activity feature is only partially supported by dynamic submodels. These submodels are driven by the expression level values in the time course data tables, and fully variable expression levels have not yet been implemented for those tables. They are still given discrete levels: No Data, Off, Weak, and On. In the current version, a preset variable activity level is used to depict those genes with a Weak expression level. This level is globally assigned as a display option. Select Edit->Set Display Options... from the main menu, and in the dialog box, enter a value between 0.0 and 1.0 in the Expression level for weak expression field (default is 0.5):
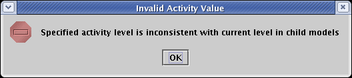
Finally, in the above example, we only assigned variable activity levels in the submodels at the bottom of the model hierarchy. You can assign variable activity levels at any submodel level, but you need to keep in mind that the activity levels assigned in lower models must be bounded by the levels set in the parent models. For example, if a submodel has a level of 0.75 set for a gene, the level set for that gene in the parent model must be at least 0.75. If you try to set it lower, you will get an error message like the following:
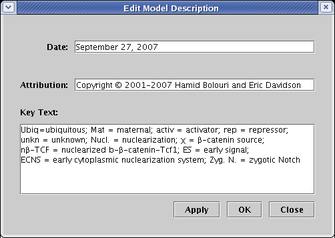
There are a few ways to add text annotations to a model. First, there are three standard fields for tagging all models in the hierarchy, which can be edited by selecting Data->Edit Model Description Data... from the main menu. These fields are designed to handle two single-line tags (Date and Attribution), as well as a multi-line block of text (Key Text). Despite their names, you can put whatever you want in these fields, and they can be dragged anywhere in the workspace:
There are also a couple of standard text fields that you can change on a per-model basis. To edit these, right-click on the model in the left-hand navigation view, and select Edit Model Properties... from the menu:
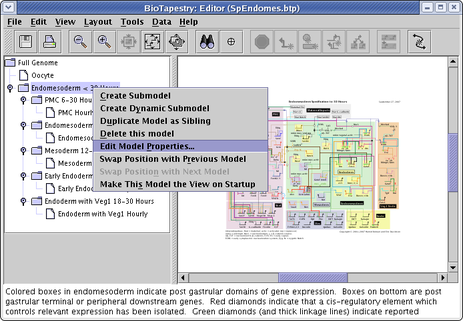
The Model Name is what shows up in the navigation view. The Long Name is used to create a large, bold model title, typically centered above the network view (though it can be dragged anywhere in the model). Finally, the Description is what appears in the message box at the bottom of the BioTapestry window when you first select the model (as shown in the figure above).

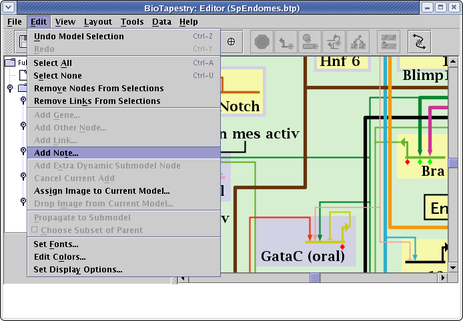
Another way to annotate a model is to add Notes (these can only be added to submodels, not to the top-level model). To add a note, select Edit->Add Note... from the main menu:
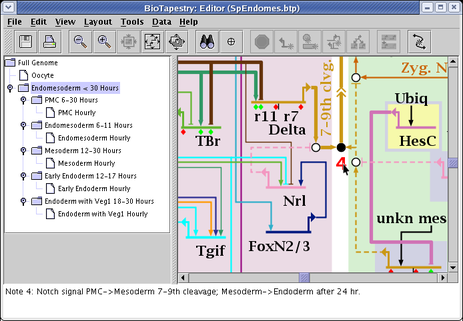
A dialog appears, and you can set the note label and message, then place the note wherever you wish. The notes appear as red text in the model and you can drag them around, and right-click on them to edit or delete them. Whenever you click on the note, the message appears in the message box at the bottom of the BioTapestry window:
One way to build a network hierarchy is to use the comma-separated value file format described in the online CSV Tutorial. At this time, not all features are available if you use this route, and specifying link evidence levels (i.e. the colored diamonds) is one such unsupported feature. In the meantime, it is possible to use a script that directly modifies the .btp file (which is in XML format) to add this information. We can pass the script along if you drop us a line.
If you are using Microsoft Excel to build up a comma-separated value (CSV) file to import into BioTapestry, you need to save it as a "CSV" file to load it in. But it turns out in some configurations, Excel will create a comma-separated value file that doesn't use commas to separate the values.
In at least some versions of Windows, it turns out that Excel chooses to use the regional settings for formatting the CSV file. In some European localizations, this means that semicolons are used instead of commas. If you computer is regionalized to a European setting that doesn't use commas, the following fix seems to work.
Change the separator in a CSV text file:
1. Click the Windows Start menu.
2. Click Control Panel.
3. Open the Regional and Language Options dialog box.
4. Click the Regional Options Tab.
5. Click Customize.
6. Type a new separator in the List separator box.
7. Click OK twice.
So if you think this might be an issue, take a look at your CSV file in a text editor make sure it is formatted correctly.